UC-1.3 — Proportional Contribution of Regulatory References
Module: 1 – Comparative Assessment of Databases, Samples, and Regulatory Frameworks
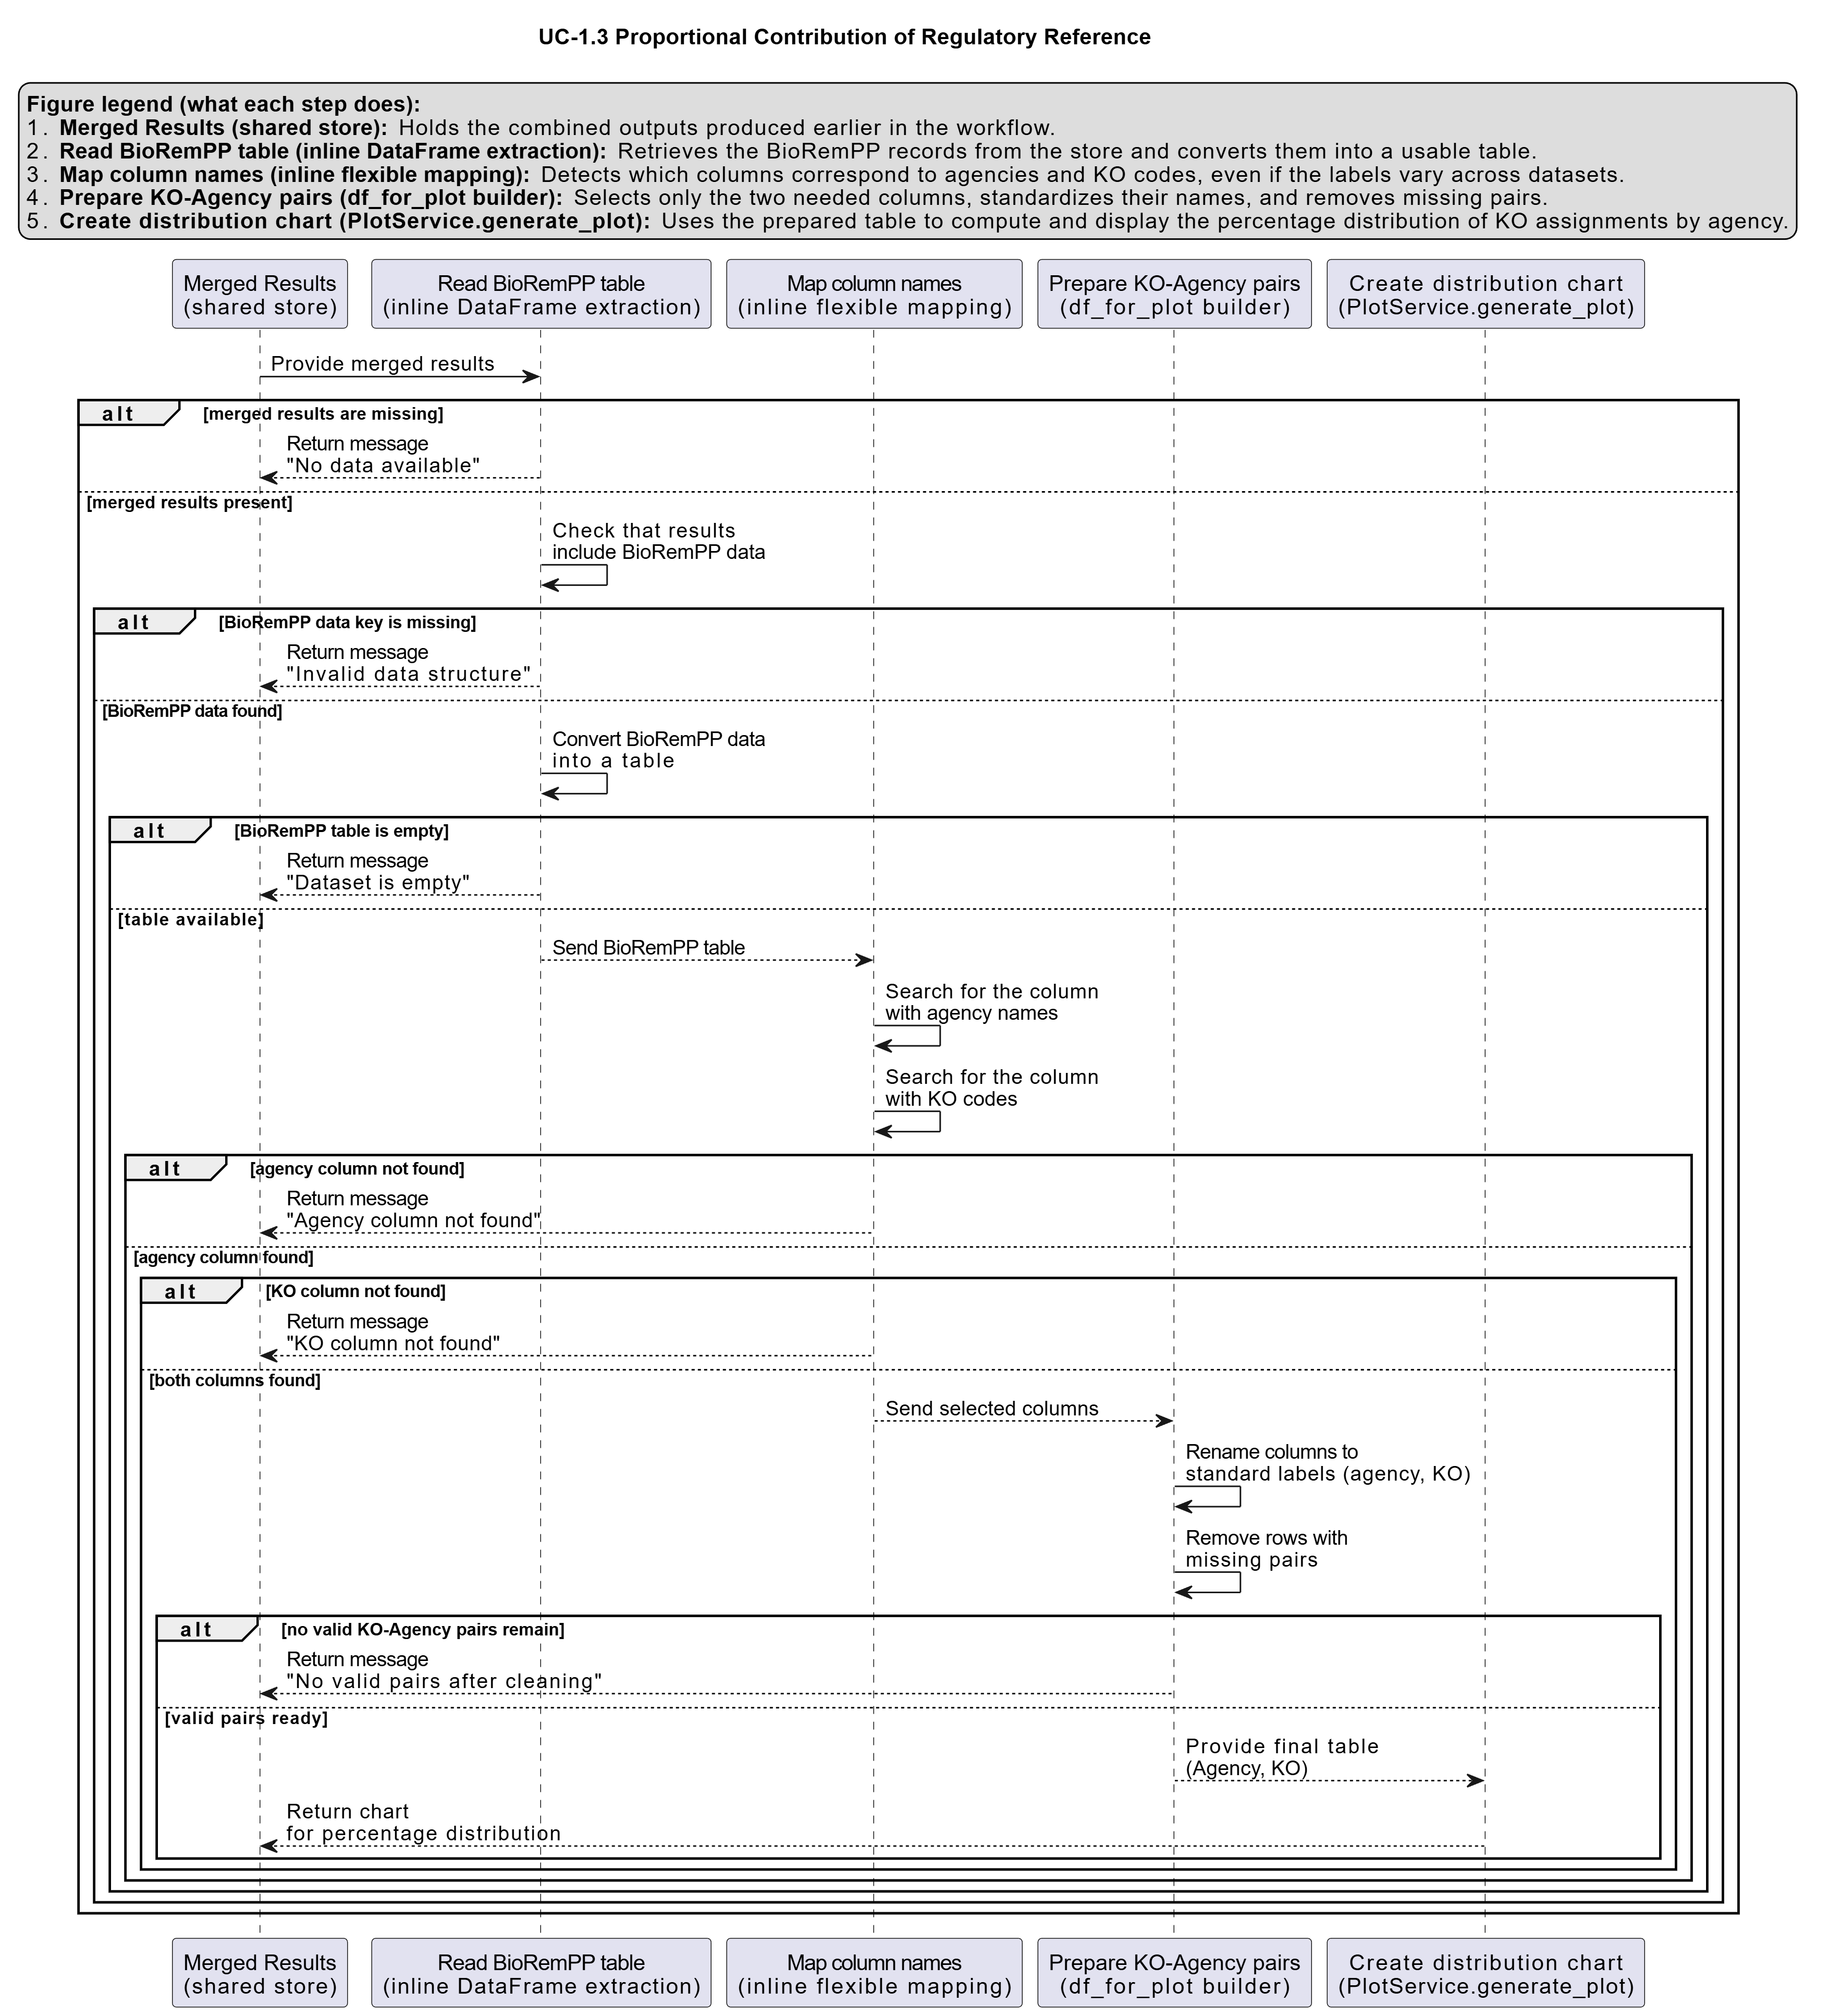
Visualization type: 100% stacked bar chart (proportional contribution of KO diversity)
Primary inputs: BioRemPP results table with referenceAG and ko columns
Primary outputs: Proportional contribution of unique KO identifiers per regulatory agency
Scientific Question and Rationale
Question: What is the proportional representation of each regulatory agency's associated KO annotations within the total unique KO diversity observed across the entire dataset?
This use case provides a high-level overview of the KO annotation distribution by partitioning the complete set of unique KEGG Orthology (KO) identifiers according to the regulatory context in which they appear. Specifically, it quantifies how much of the total KO diversity can be attributed to compounds linked to each regulatory or scientific agency (referenceAG). The resulting 100% stacked bar chart summarizes the relative proportional representation of each regulatory framework's associated KO annotations, enabling rapid comparison of how different agencies map onto the annotation pool captured by BioRemPP.
Data and Inputs
- Primary data source: BioRemPP results table
- Key columns:
referenceAG– identifier for the regulatory or scientific agency (e.g., WFD, CONAMA, EPC)ko– KEGG Orthology identifier associated with the annotated function- Accepted format: semicolon-delimited text table (
.txtor.csv) - Entity of interest: unique KO identifiers associated with each agency
Analytical Workflow
-
Data Loading
The primary results table produced by the BioRemPP analysis is loaded into memory. -
Filtering
The dataset is filtered to retain only records containing both a non-emptyreferenceAGand a validkoidentifier. This ensures that each retained row can be unambiguously assigned to a regulatory context and a functional annotation. -
Aggregation The filtered data is grouped by each unique
referenceAG. Within each group, the total number of distinct KO identifiers is computed. Each count reflects the KO annotation count associated with that agency. -
Normalization and Rendering
The per-agency counts of unique KOs are visualized as segments within a single bar using a 100% stacked bar chart. Thebarnorm='percent'setting normalizes these counts such that: - the full bar corresponds to 100% of all unique KOs in the dataset, and
- each segment's length is proportional to the percentage contribution of that agency's KO diversity.
How to Read the Plot
The 100% stacked bar chart can be interpreted as follows:
-
Single Bar (Global KO Pool)
The chart consists of a single vertical (or horizontal) bar representing 100% of the unique KOs identified in the dataset across all regulatory contexts. -
Colored Segments (Per-Agency Contributions)
Each colored segment within the bar corresponds to one Reference Agency (referenceAG). The color distinguishes each agency's contribution. -
Segment Length and Labels The length of each segment, together with its percentage label, indicates that agency's proportional share of the total unique KO pool. Larger segments represent agencies whose associated compounds overlap with a greater number of unique KOs in the dataset.
Representative Output
The image below illustrates a representative output generated by this use case using the example dataset.
Click on the image to enlarge and explore details.
Interpretation and Key Messages
-
Dominant Contributions Larger segments indicate that the associated regulatory agency's compound list overlaps with a greater proportion of the KO diversity in this dataset. This reflects annotation coverage within BioRemPP and does not necessarily indicate broader environmental relevance or the comprehensiveness of the regulatory framework itself.
-
Specialized Scope Smaller segments may reflect agencies with a more targeted compound list, whose regulated substances are associated with a narrower set of KO annotations in the dataset. This may stem from a more restricted compound list or lower KO annotation density for those compounds.
-
Proportional Annotation Overview By summarizing KO annotation counts in a single normalized bar, the chart provides an at-a-glance comparison of each regulatory context's relative representation in the annotation pool, which can help orient exploration of which regulatory frameworks are more or less represented in the dataset.
Reproducibility and Assumptions
-
Input Format
The analysis assumes a semicolon-delimited table containing at least the columnsreferenceAGandko. -
Uniqueness Definition
Counts are based on unique KO identifiers per agency. If the same KO is linked to multiple compounds under the samereferenceAG, it is still counted only once for that agency. -
Normalization
Percentages are computed relative to the global union of all unique KOs across all agencies, ensuring that the full bar always corresponds to 100% of the KO diversity represented in the dataset.
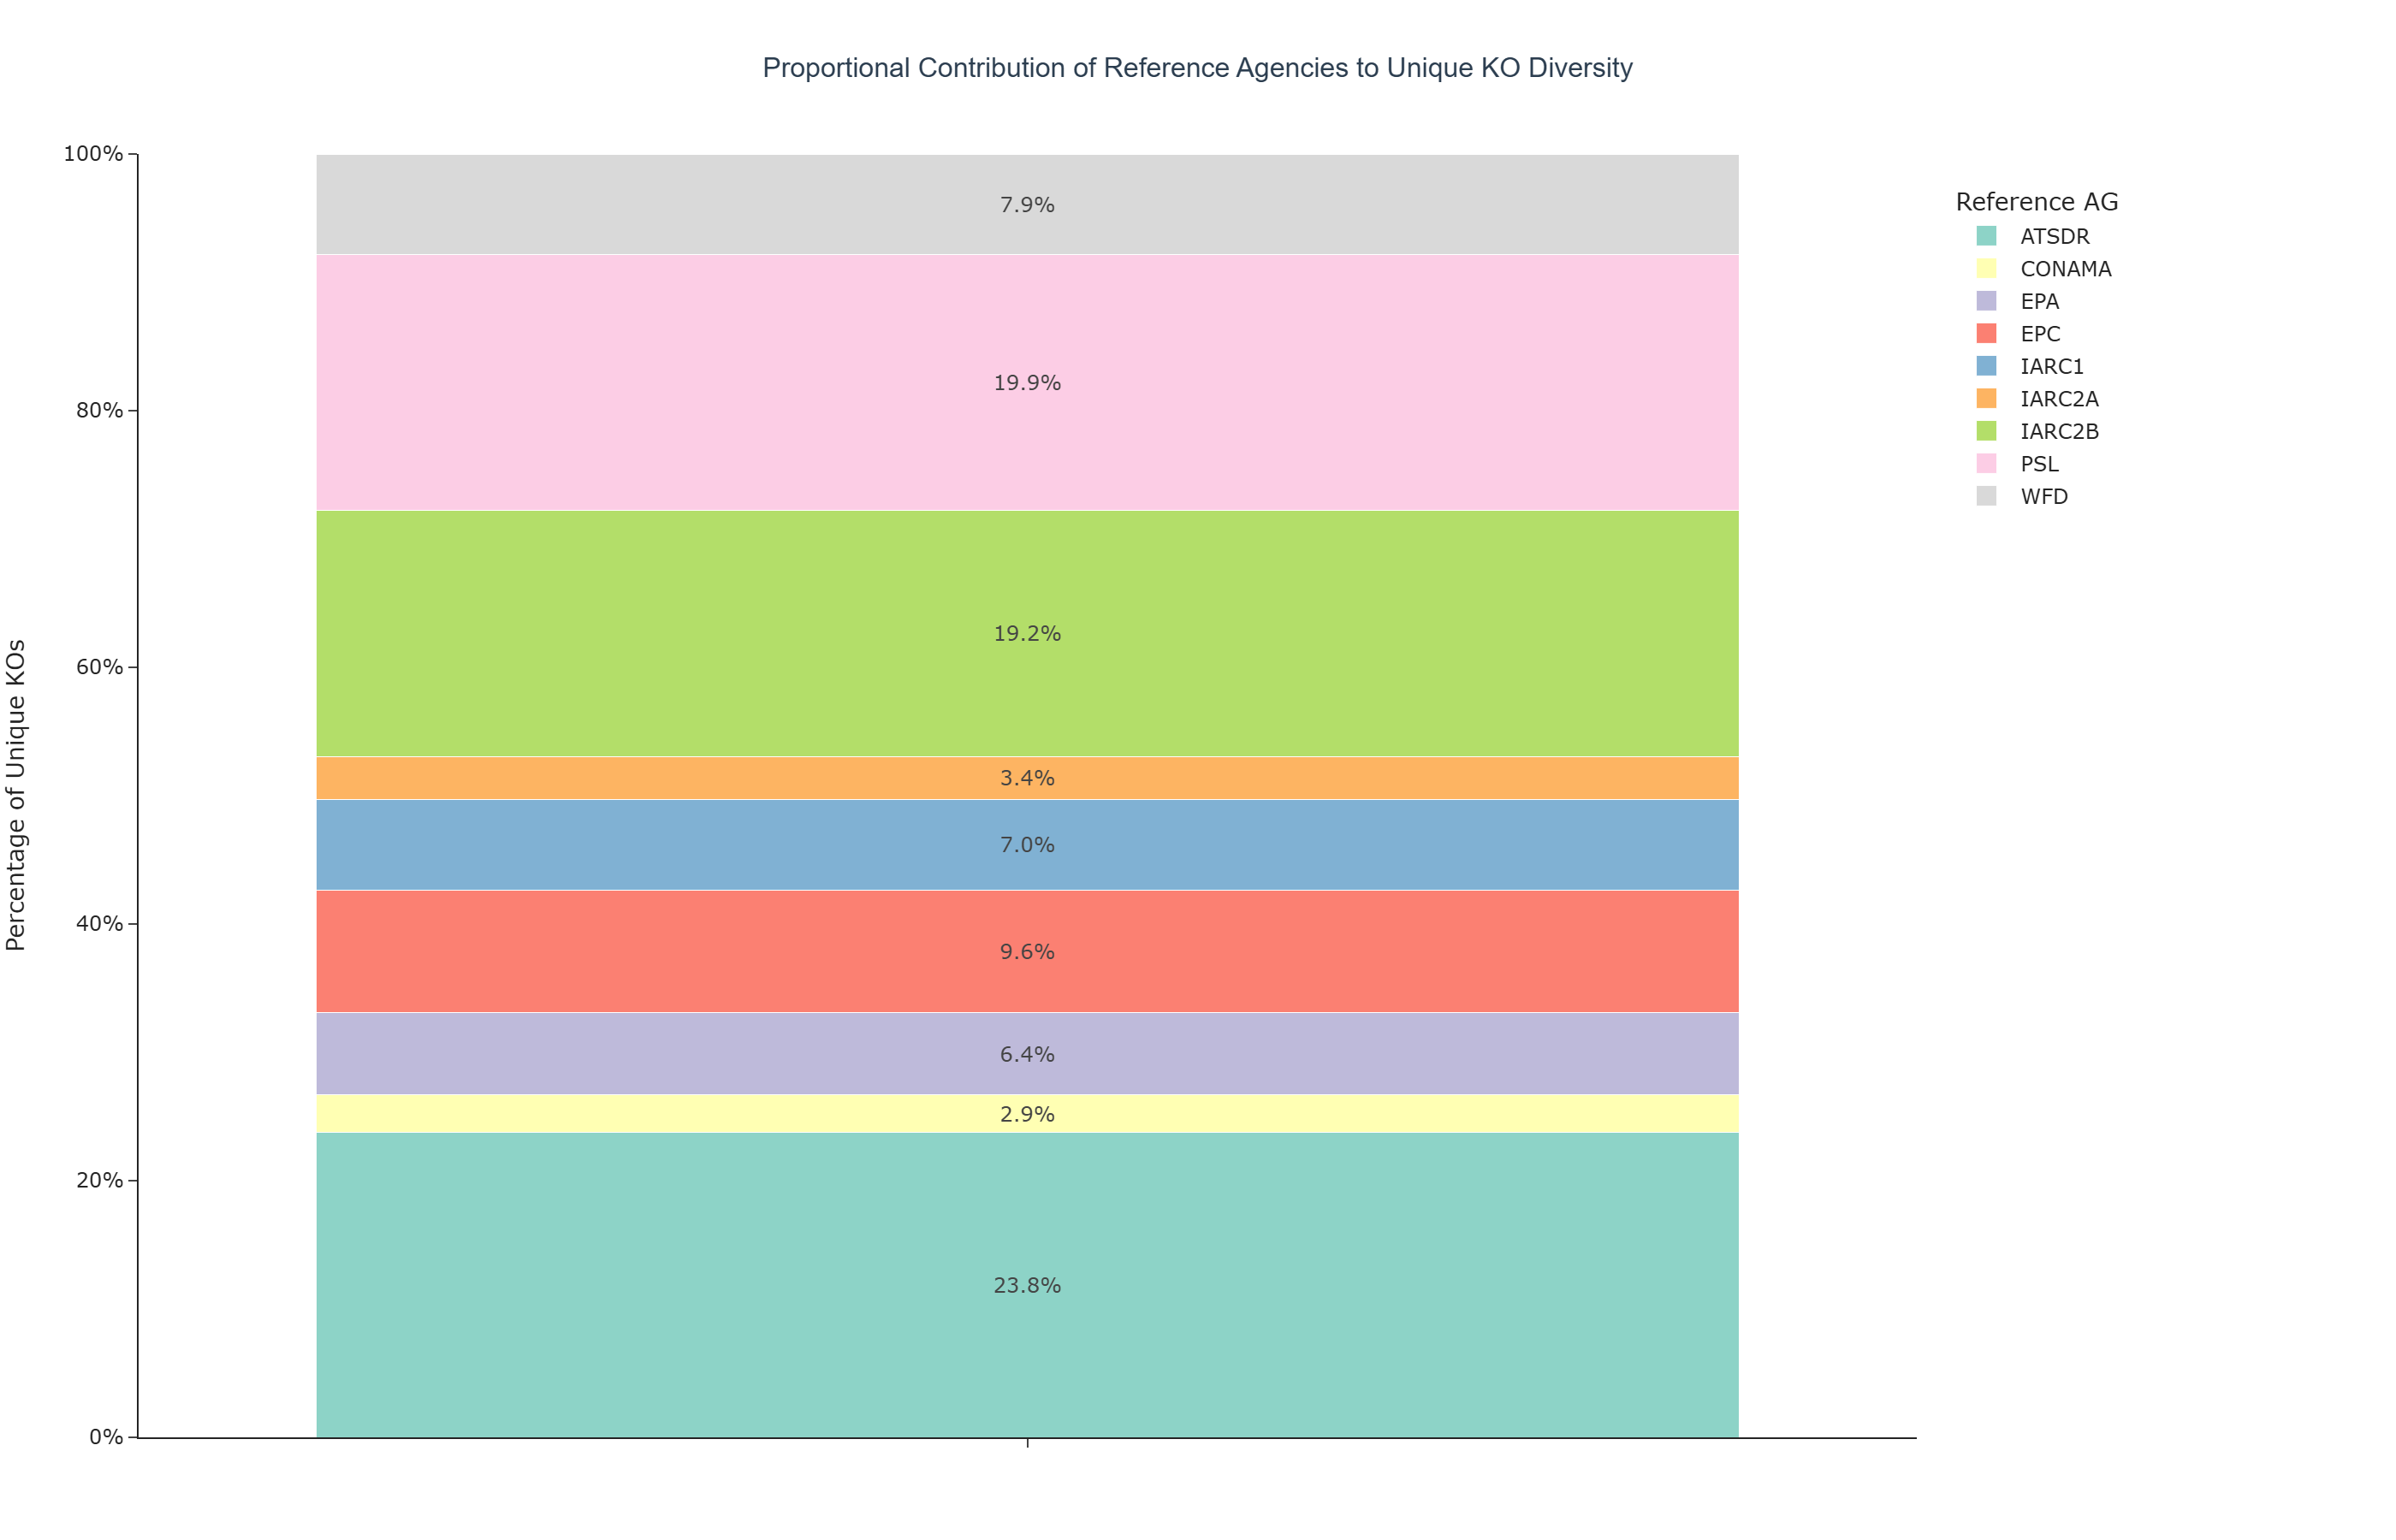
Activity diagram of the use case
Click on the image to enlarge and explore details.