UC-1.4 — Proportional Contribution of Samples Unique KO Pool
Module: 1 – Comparative Assessment of Databases, Samples, and Regulatory Frameworks
Visualization type: 100% stacked bar chart (proportional contribution of KO diversity per sample)
Primary inputs: BioRemPP results table with sample and ko columns
Primary outputs: Proportional contribution of unique KO identifiers per sample
Scientific Question and Rationale
Question: What is the relative KO annotation breadth of each biological sample compared to the total unique KO pool observed across the entire dataset?
This use case provides a high-level overview of the KO annotation distribution by decomposing the global pool of unique KEGG Orthology (KO) identifiers into sample-specific contributions. By expressing each sample's unique KO annotation count as a fraction of the total, the visualization enables direct comparison of KO annotation breadth across samples and can highlight which ones contribute the greatest share to the total annotation pool captured by BioRemPP.
Data and Inputs
- Primary data source:
BioRemPP_Results.xlsx or BioRemPP_Results.csv - Key columns:
sample– identifier for each biological sampleko– KEGG Orthology identifier associated with the annotated function- Accepted format: semicolon-delimited text table (
.txtor.csv) - Entity of interest: unique KO identifiers associated with each sample
Analytical Workflow
-
Data Loading and Parsing
The primary results table (BioRemPP_Results.xlsx or BioRemPP_Results.csv) is loaded and parsed from its semicolon-delimited format. -
Filtering and Standardization
The dataset is filtered to retain only records containing validsampleandkoidentifiers. Both fields are standardized (e.g., trimming whitespace, harmonizing case) to ensure consistency and prevent spurious duplication. -
Aggregation The filtered data is grouped by each unique
sample. Within each group, the number of distinct KO identifiers is computed. This count reflects the KO annotation count for that sample. -
Normalization and Rendering
The per-sample counts of unique KOs are visualized as segments within a single bar using a 100% stacked bar chart. The counts are normalized so that: - the full bar corresponds to 100% of all unique KOs found across all samples, and
- each segment's length is proportional to that sample's percentage contribution to the global unique KO pool.
How to Read the Plot
The 100% stacked bar chart can be interpreted as follows:
-
Single Bar (Global KO Pool)
The chart consists of a single vertical (or horizontal) bar that represents 100% of the unique KOs detected across all samples in the dataset. -
Colored Segments (Per-Sample Contributions)
Each colored segment within the bar corresponds to a specific Sample. -
Segment Length and Labels The length of each segment, together with its percentage label, indicates that sample's proportional share of the total unique KO pool. Larger segments represent samples contributing a greater number of unique KOs to the dataset.
Representative Output
The image below illustrates a representative output generated by this use case using the example dataset.
Click on the image to enlarge and explore details.

Interpretation and Key Messages
-
KO Annotation Breadth Larger segments correspond to biological samples with a greater proportion of the total unique KO diversity in the dataset. This reflects annotation breadth within the current dataset and may serve as a basis for comparing relative KO annotation coverage across samples.
-
Comparative KO Coverage The chart can provide a rapid, at-a-glance comparison of the proportional KO annotation contribution of each sample. Samples with markedly larger segments contribute more unique KOs to the total pool, which may reflect broader annotation coverage or more diverse metabolic gene content in the source data.
-
Narrow Annotation Coverage Samples with smaller segments contribute fewer unique KOs proportionally. This may reflect a more restricted annotation profile, smaller dataset size, or a more focused metabolic repertoire — and should not be interpreted as lower biological relevance without additional context.
Reproducibility and Assumptions
-
Input Format
The analysis assumes a semicolon-delimited table containing at least the columnssampleandko. -
Uniqueness Definition KO annotation count is defined as the count of unique KO identifiers per sample. If the same KO appears multiple times (e.g., linked to multiple genes or compounds) within a given sample, it is counted only once for that sample.
-
Normalization
Percentages are computed relative to the global union of all unique KOs across all samples, ensuring that the full bar always corresponds to the complete KO diversity present in the dataset.
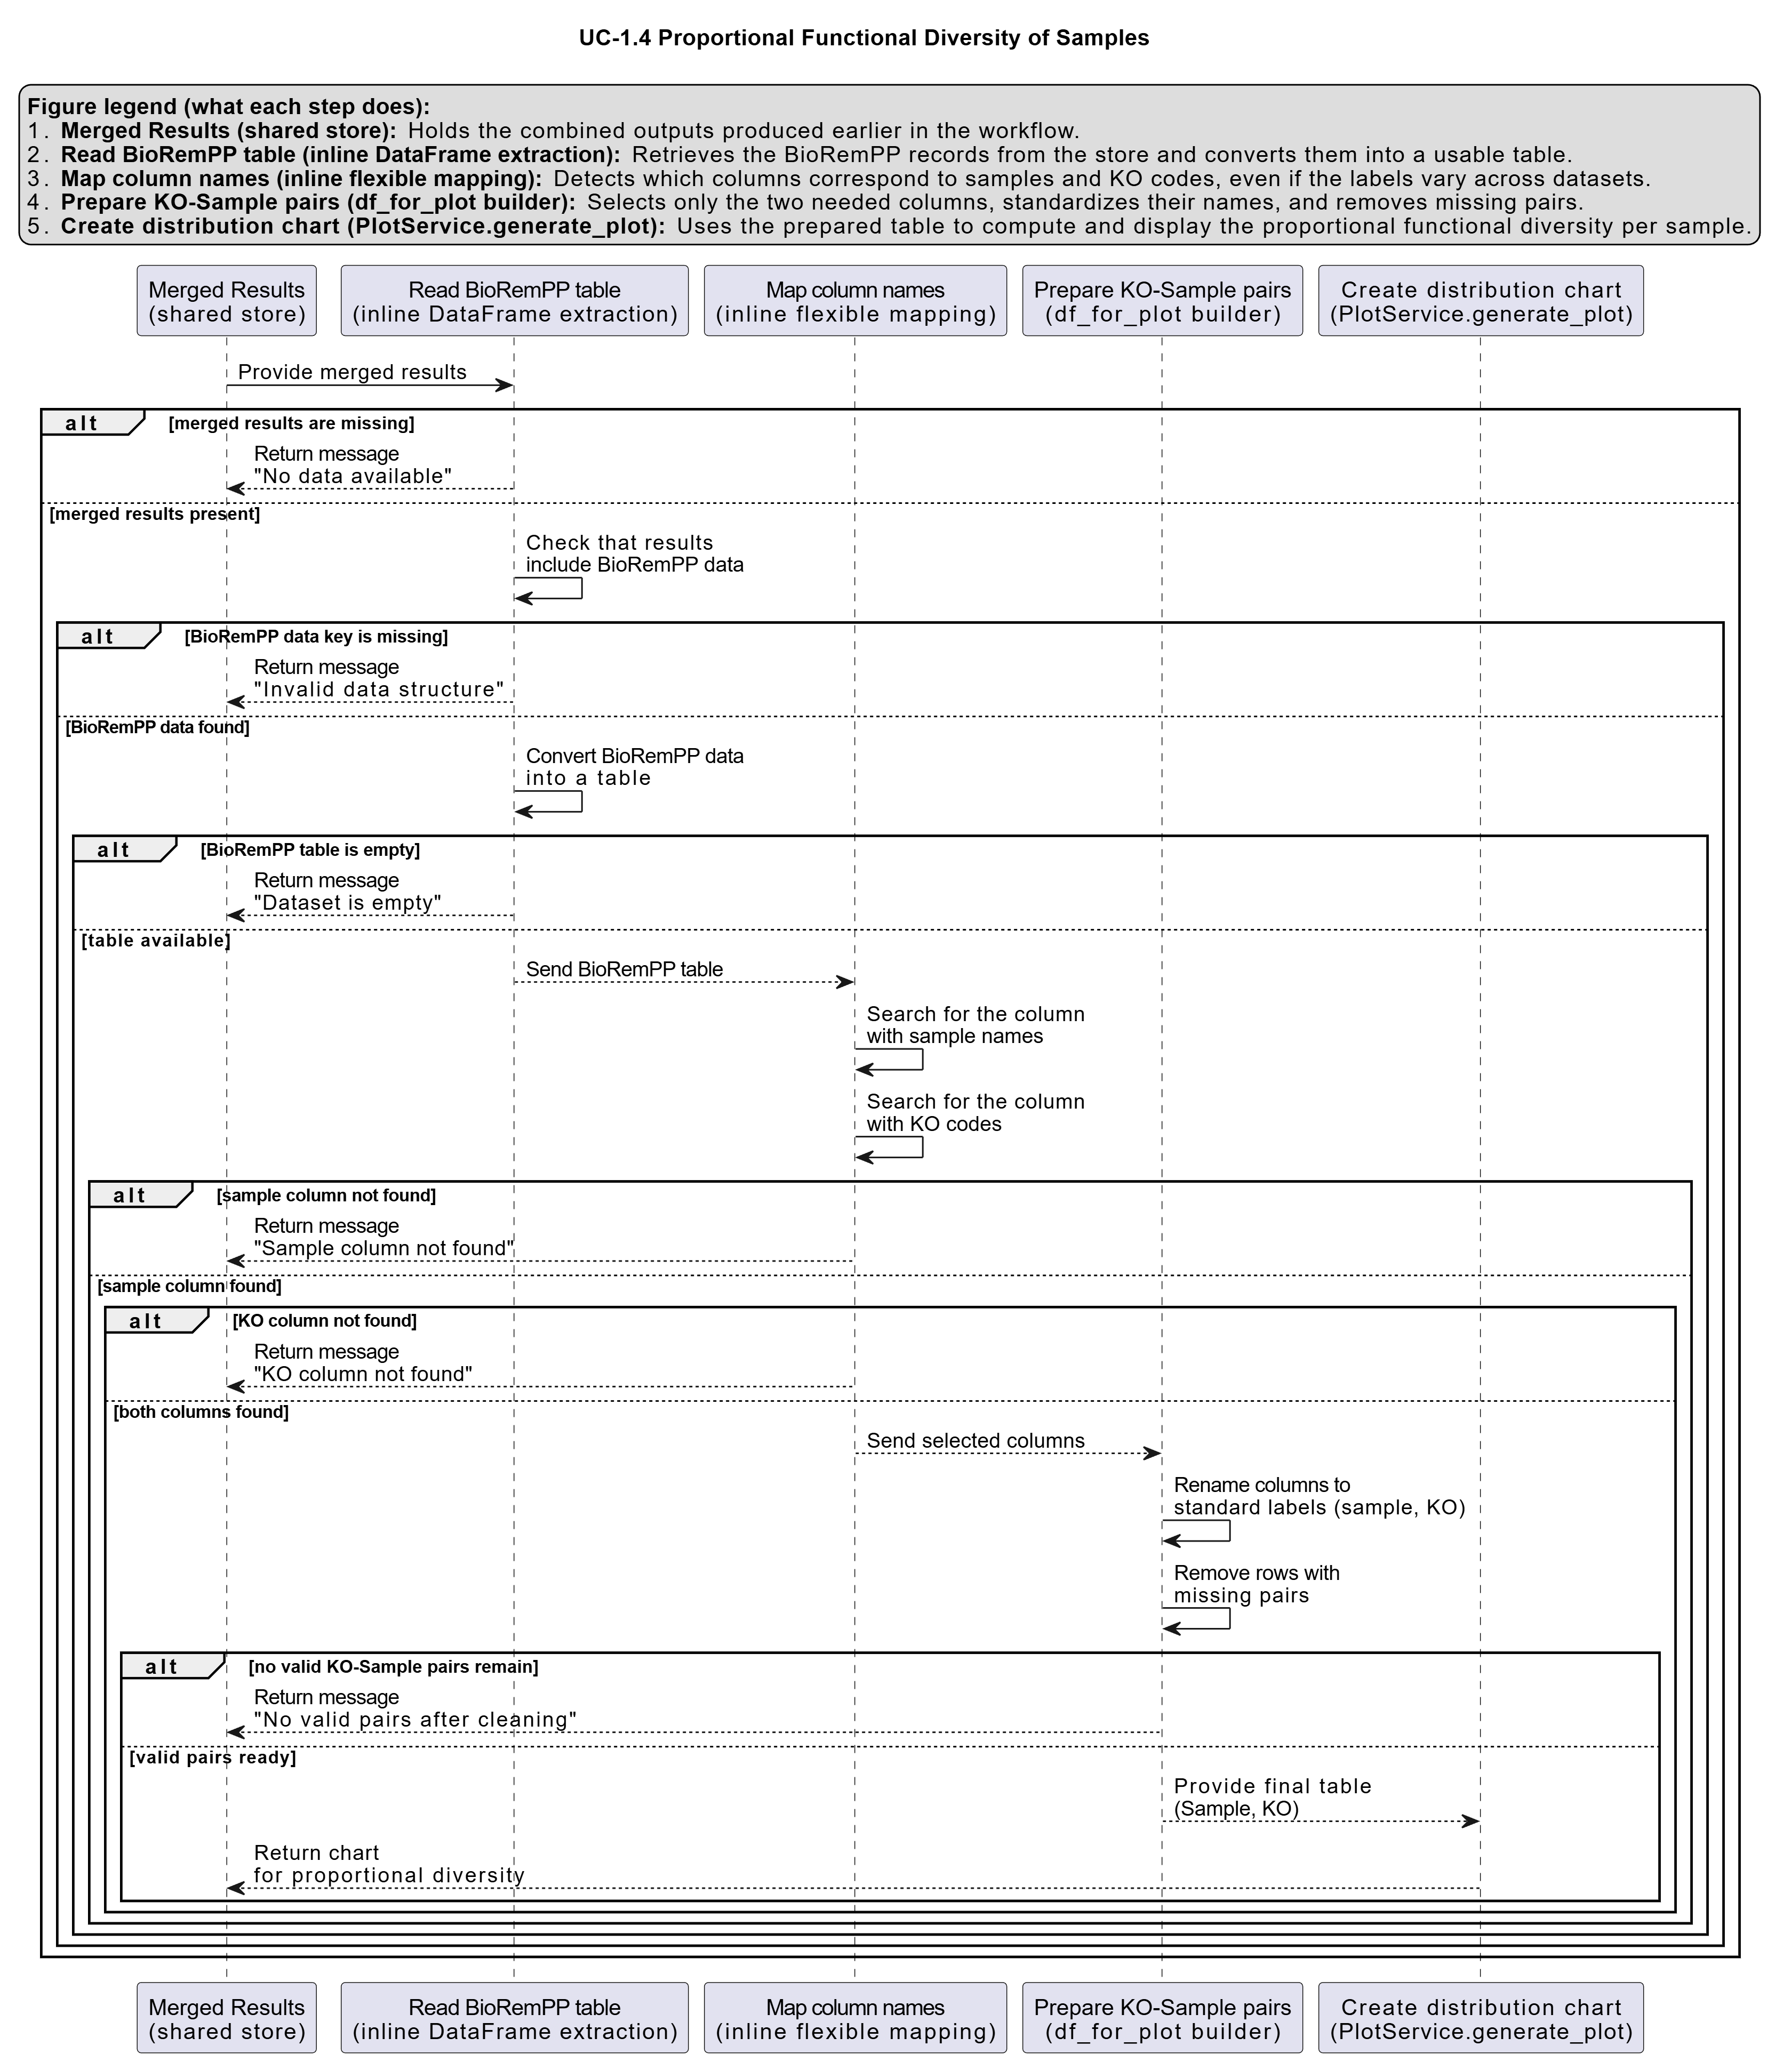
Activity diagram of the use case
Click on the image to enlarge and explore details.