UC-1.5 — Regulatory Reference Compliance Scorecard
Module: 1 – Comparative Assessment of Databases, Samples, and Regulatory Frameworks
Visualization type: Heatmap (compliance scores of samples vs. regulatory agencies)
Primary inputs: BioRemPP results table with sample, referenceAG, and compoundname columns
Primary outputs: Compliance Score matrix (samples × regulatory agencies)
Scientific Question and Rationale
Question: To what extent does the annotated compound repertoire of each biological sample overlap with the compound lists of different regulatory agencies, as measured by the percentage of monitored compounds co-annotated in each sample?
This use case quantifies the annotation-level overlap between each biological sample and major regulatory agency compound lists. The heatmap displays a computed Annotation Overlap Score (Compliance Score), which represents the percentage of an agency's listed compounds that are co-annotated in a given sample. This perspective can be useful for exploring which samples have broader or narrower compound annotation coverage relative to specific regulatory frameworks.
Data and Inputs
- Primary data source:
BioRemPP_Results.xlsx or BioRemPP_Results.csv - Key columns:
sample– identifier for each biological samplereferenceAG– identifier for the regulatory or scientific agency (e.g., WFD, CONAMA, EPC)compoundname– name of the chemical compound associated with the interaction- Accepted format: semicolon-delimited text table (
.txtor.csv) - Entities of interest:
- Samples: biological sources with co-annotated compounds in the dataset
- Regulatory agencies: references defining sets of monitored or priority compounds
Analytical Workflow
-
Data Loading
The primary results table (BioRemPP_Results.xlsx or BioRemPP_Results.csv) is loaded into memory from its semicolon-delimited format. -
Set Definition
Two types of sets are constructed: - Agency Compound Sets:
For each uniquereferenceAG, a set is created containing all uniquecompoundnamevalues it monitors. -
Sample Compound Sets: For each unique
sample, a set is created containing all uniquecompoundnamevalues co-annotated with that sample in the dataset. -
Feature Engineering (Compliance Score)
For every sample–agency pair, the Compliance Score (%) is computed as:
Compliance Score (%) = (shared_compounds / agency_compounds_total) * 100
- Matrix Construction
The calculated scores are pivoted into a 2D matrix where: - rows correspond to Samples,
- columns correspond to Regulatory Agencies (
referenceAG), and -
each cell contains the Compliance Score (%) for that sample–agency pair.
-
Rendering
The resulting matrix is rendered as an interactive heatmap in which color intensity is proportional to the Compliance Score. Optional value annotations (e.g., numeric labels) can be overlaid in each cell.
How to Read the Plot
-
Y-axis (Rows)
Represents individual Samples. -
X-axis (Columns)
Represents the Regulatory Agencies included in the analysis. -
Cell Color and Label
The color intensity of each cell may indicate the Compliance Score (%), with brighter or warmer colors corresponding to higher scores (better alignment). Where present, the numerical label inside the cell provides the exact percentage.
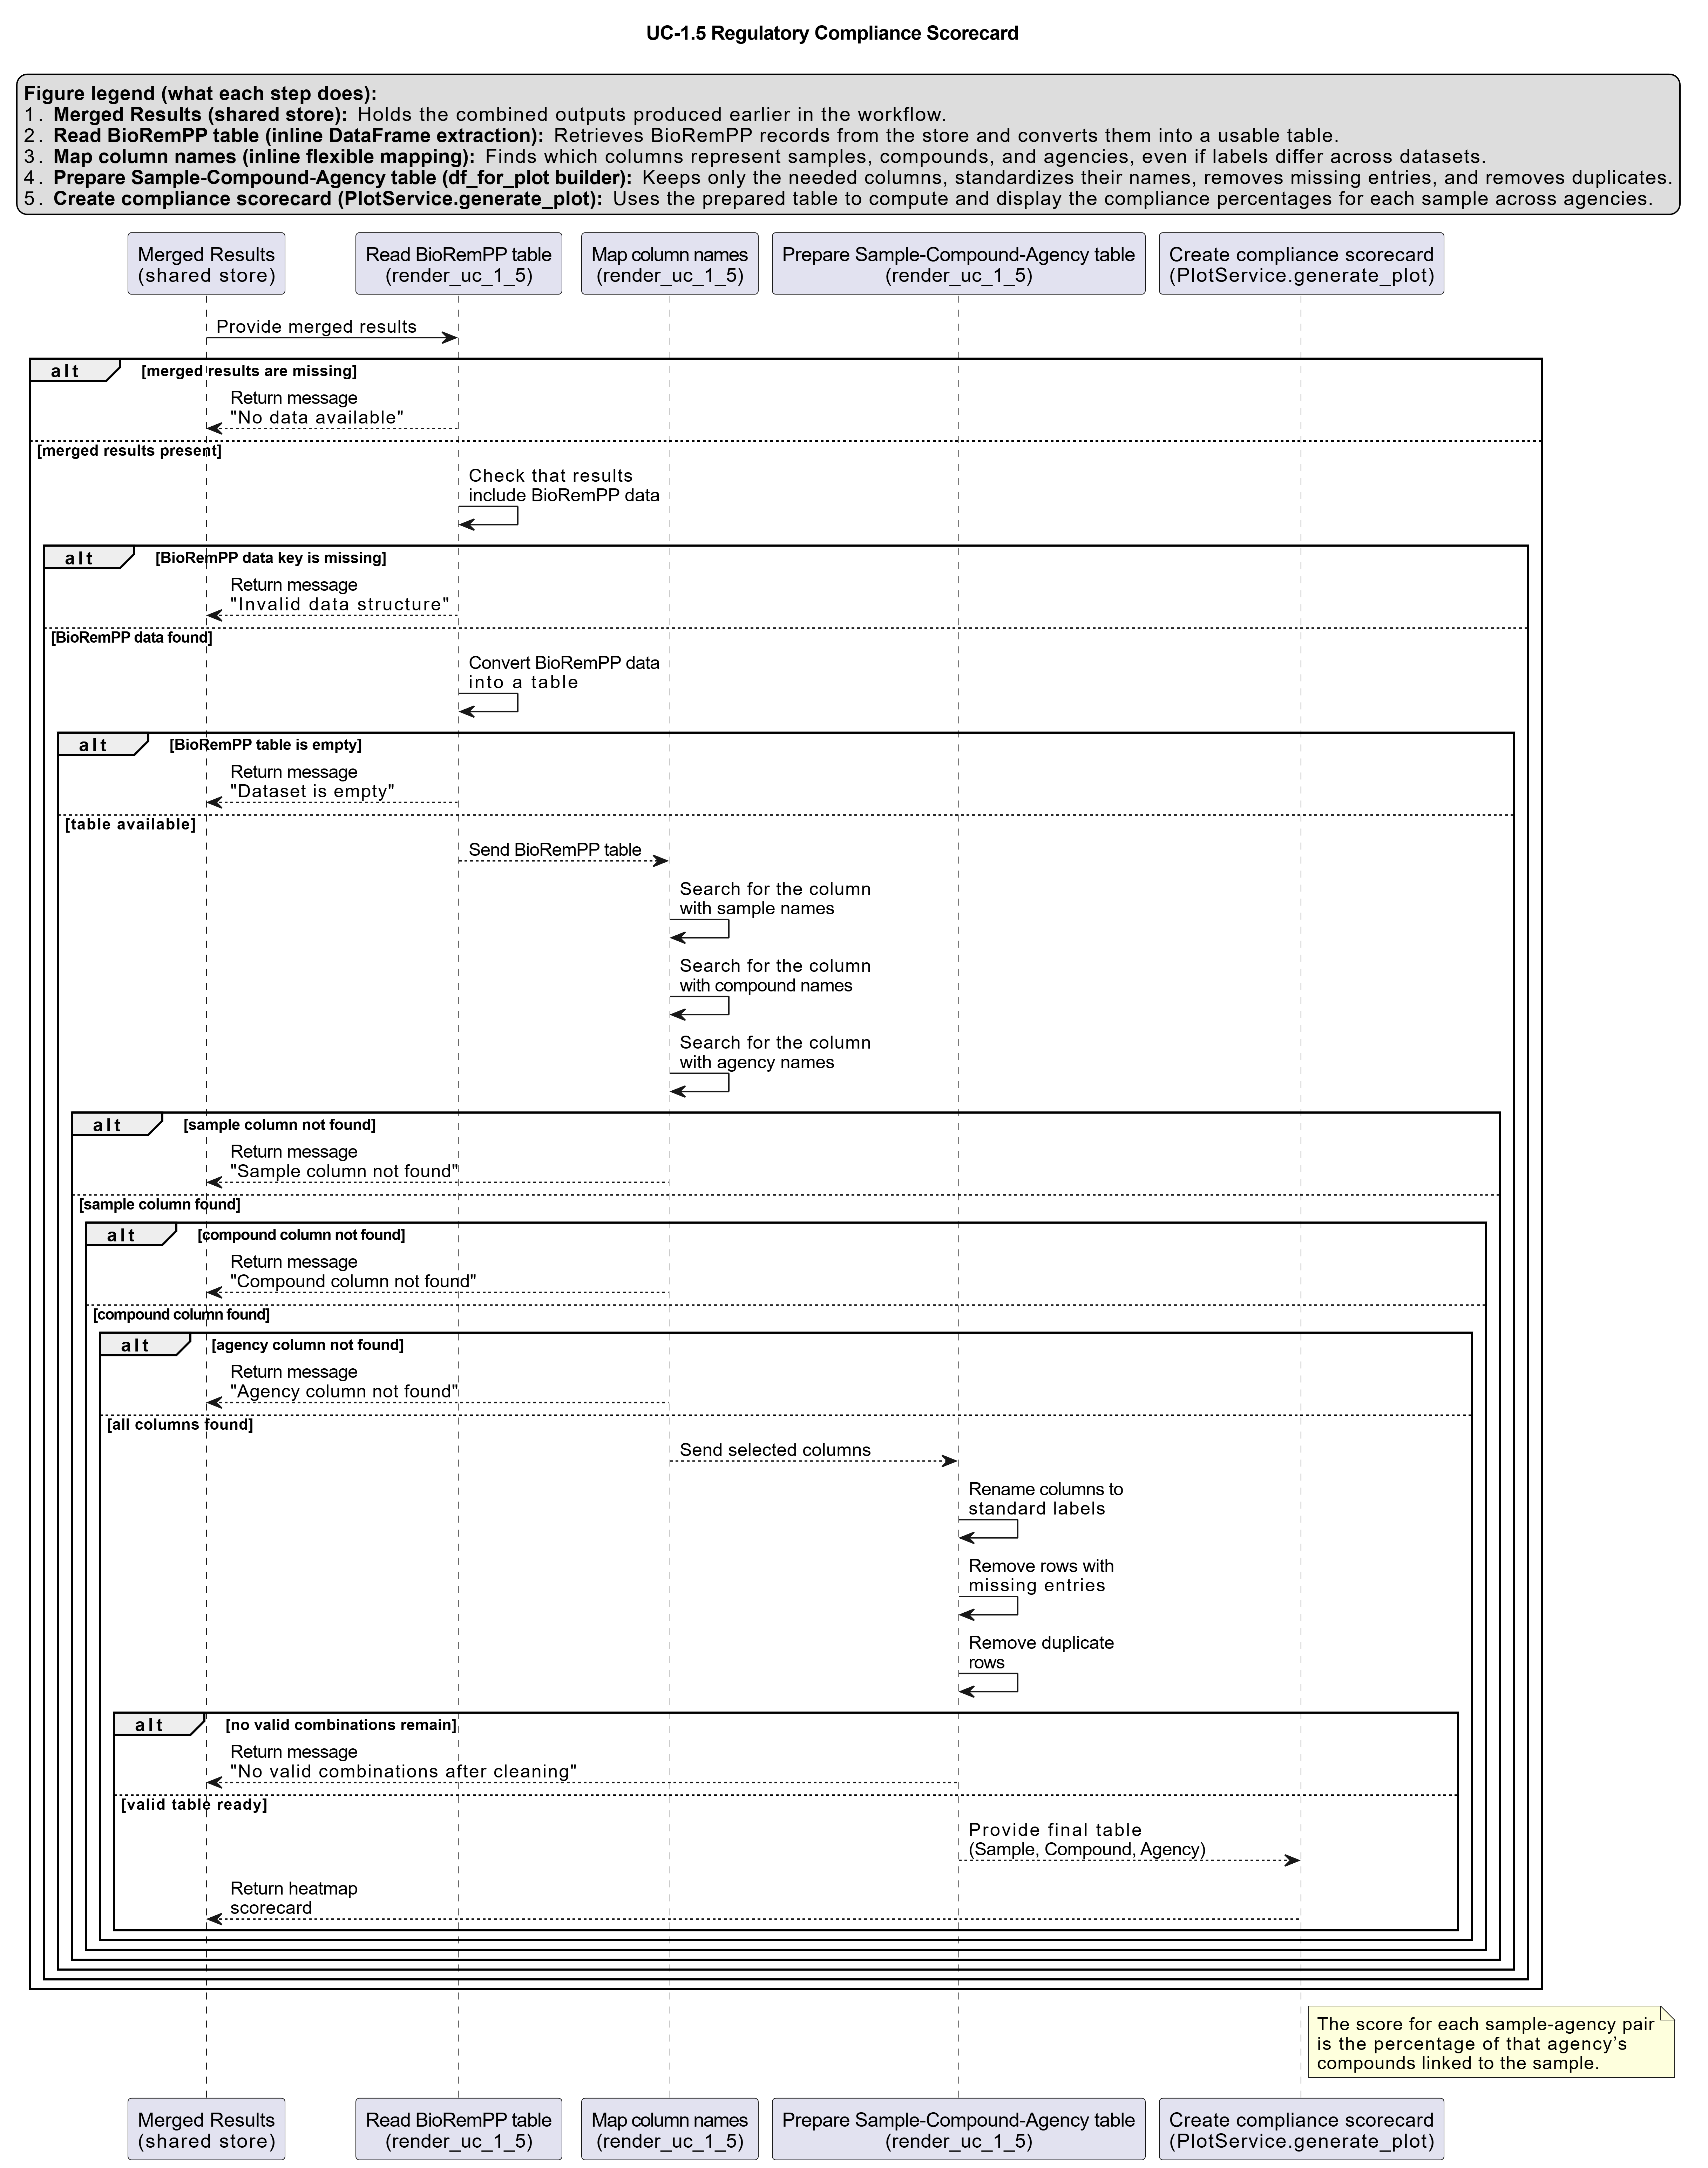
Representative Output
The image below illustrates a representative output generated by this use case using the example dataset.
Click on the image to enlarge and explore details.
Interpretation and Key Messages
-
High-Score Intersections Brightly colored cells indicate samples whose co-annotated compound repertoire overlaps substantially with compounds listed by that regulatory agency. This reflects annotation-level co-occurrence and may suggest functional relevance worth investigating, but does not confirm actual degradation capability or regulatory compliance in any operational sense. For example, a score of 95% for Sample A and Agency EPC means that 95% of EPC's listed compounds are co-annotated in Sample A's annotation — not that Sample A has confirmed capacity to degrade those compounds.
-
Broad Functional Profiles Samples with consistently elevated scores across multiple agency columns show broad overlap between their co-annotated compound set and several regulatory frameworks. This pattern may indicate broader annotation coverage and can help prioritize samples for further multi-context investigation.
-
Complementary Coverage Comparing score profiles across samples can reveal complementary patterns — samples with higher scores in different agency columns may together cover a broader annotation space. This observation may generate hypotheses about multi-sample analysis strategies, though any consortium design requires experimental validation beyond annotation data.
Reproducibility and Assumptions
-
Input Format
The analysis assumes a semicolon-delimited table containing at least the columnssample,referenceAG, andcompoundname. -
Score Definition
The Compliance Score is a normalized percentage, enabling fair comparison across agencies that may monitor very different numbers of compounds. -
Presence-Based Metric The score is based solely on the presence of compound co-annotation in each sample. It does not incorporate interaction strength, frequency, or underlying KO diversity (e.g., number of genes or KOs per compound), which are treated in separate analyses. Higher scores reflect greater annotation overlap and do not imply confirmed degradation capability.
-
Uniqueness Handling
Sets are constructed from unique compound per sample and per agency. Duplicate occurrences of the same compound within a given sample or agency are ignored when computing intersections and totals.
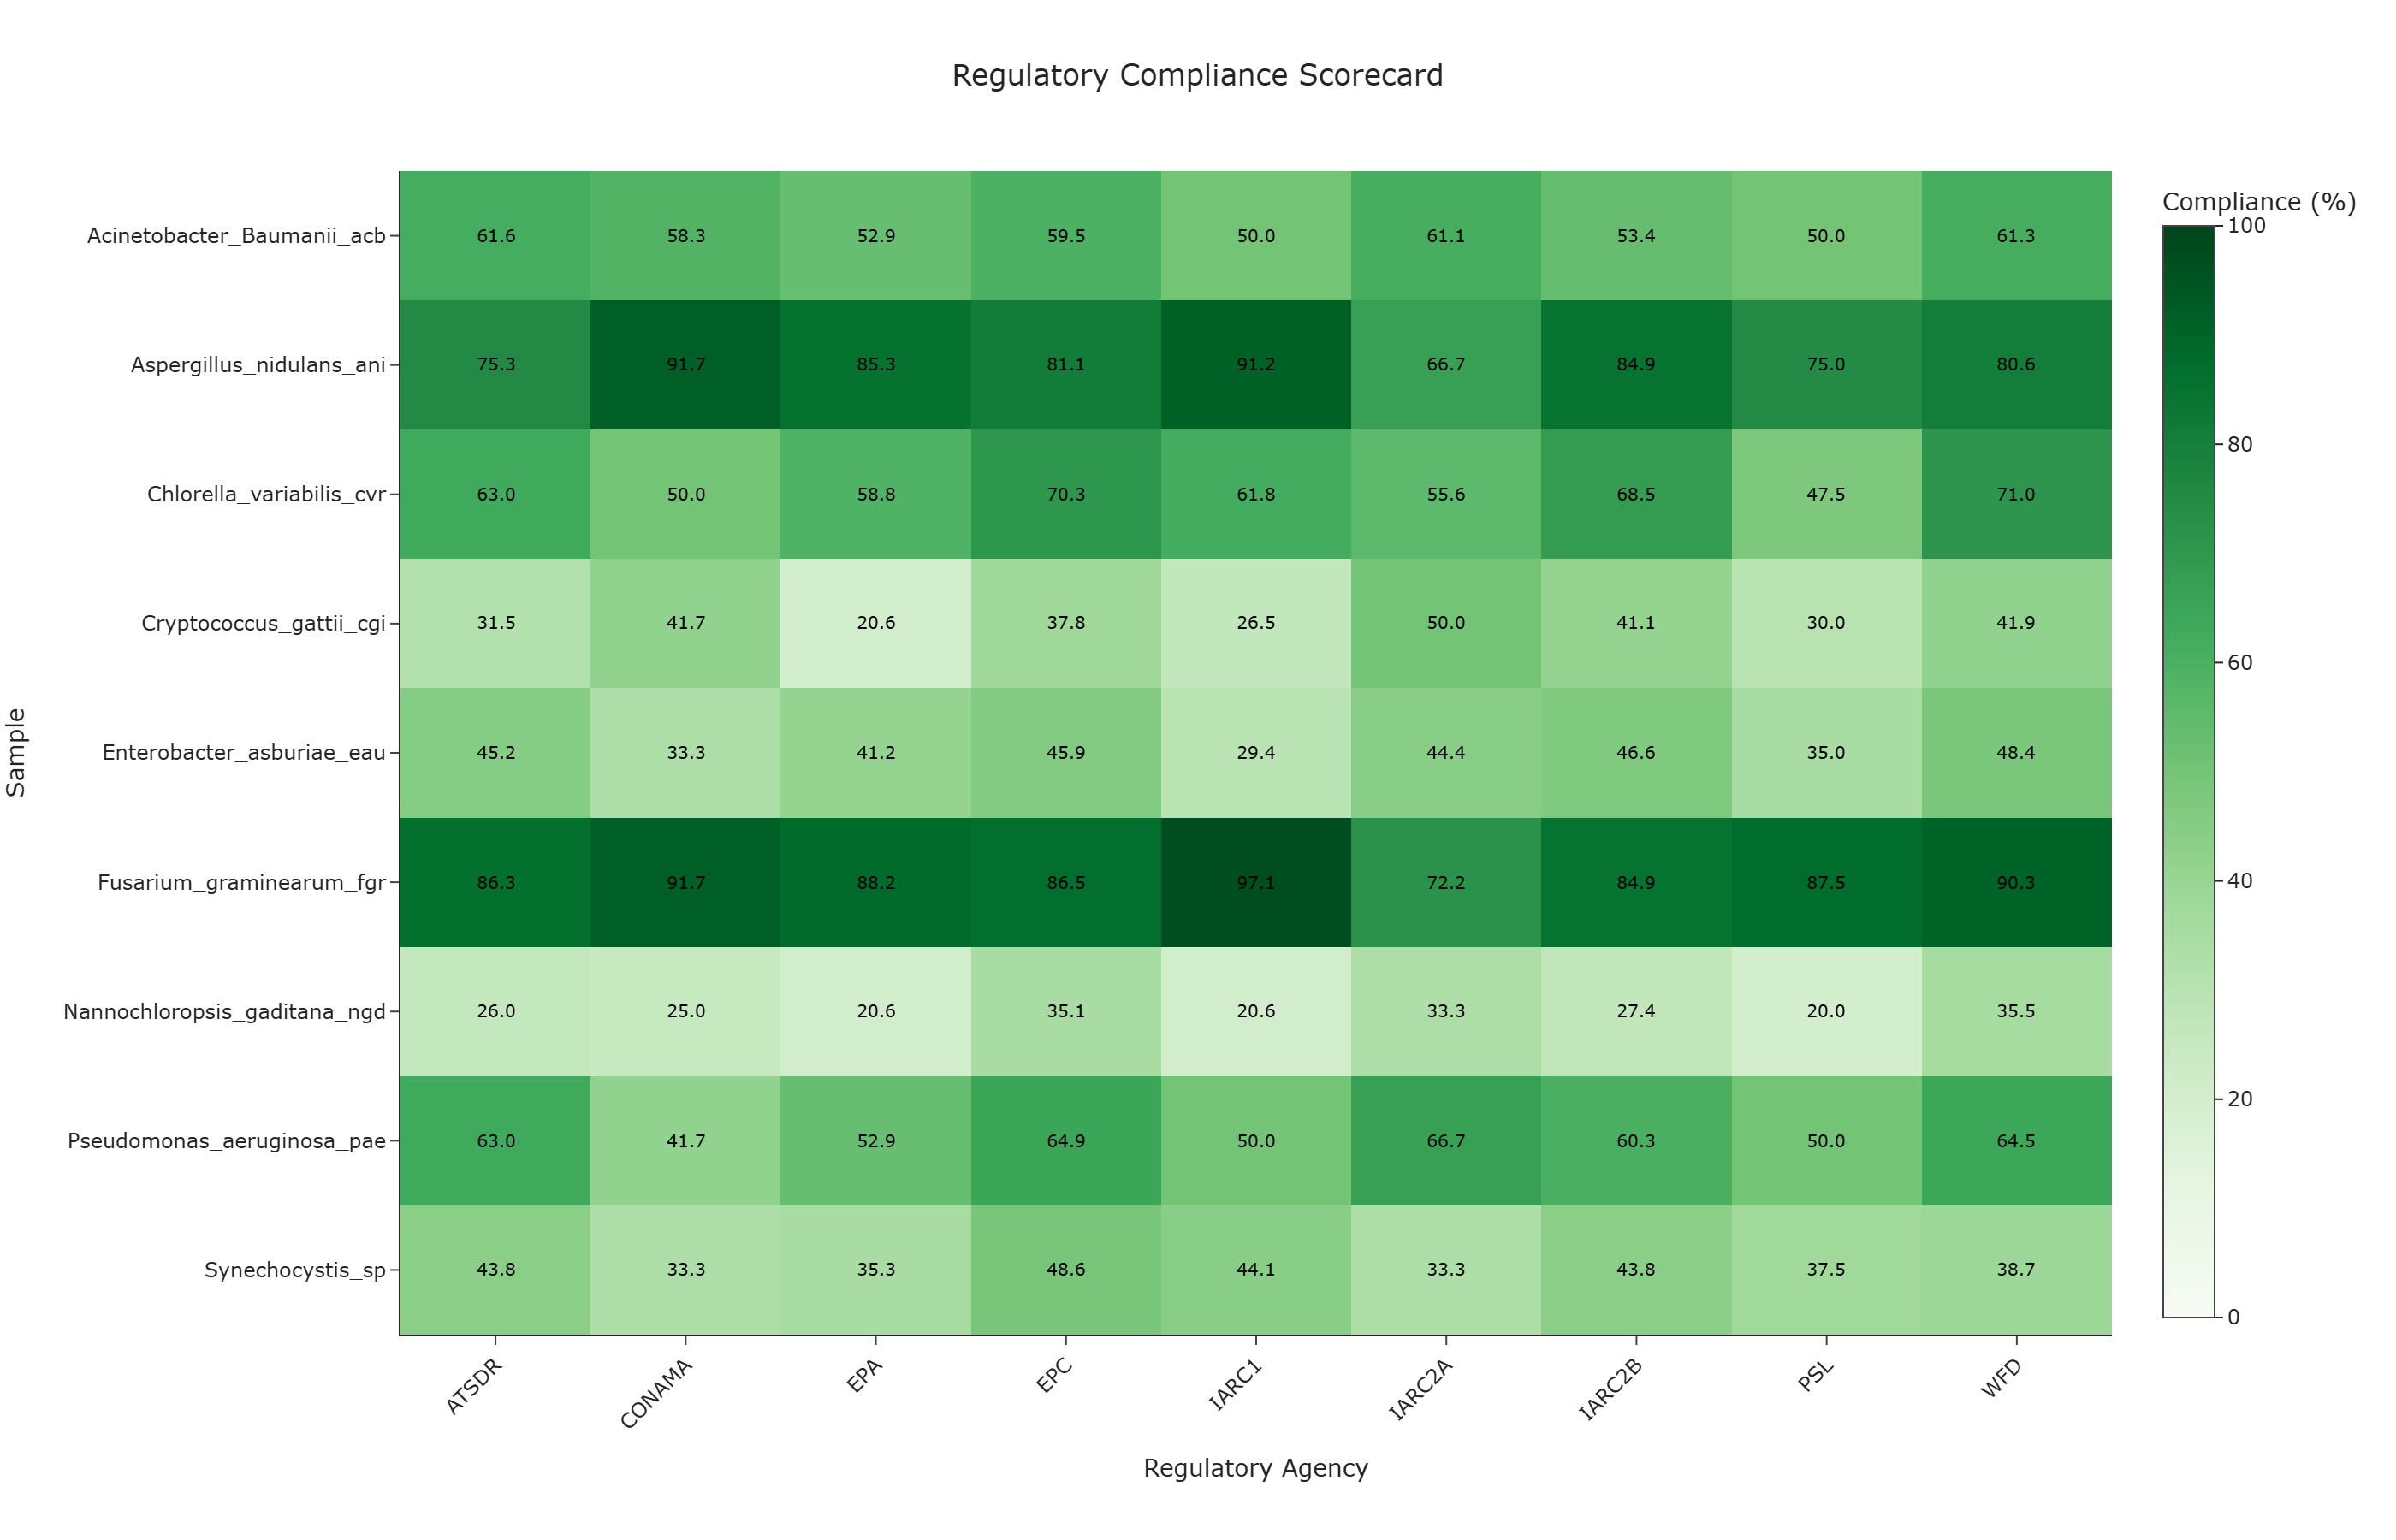
Activity diagram of the use case
Click on the image to enlarge and explore details.