UC-1.6 — Functional Potential of Samples Across Regulatory References
Module: 1 – Comparative Assessment of Databases, Samples, and Regulatory Frameworks
Visualization type: Heatmap (unique KO counts per sample–agency pair)
Primary inputs: BioRemPP results table with sample, referenceAG, and ko columns
Primary outputs: Matrix of unique KO counts (samples × regulatory agencies)
Scientific Question and Rationale
Question: To what extent does the KO annotation breadth of different samples overlap with the compound lists of various environmental regulatory agencies, as measured by unique KO counts at each sample-agency intersection?
This use case characterizes how KO annotations in each biological sample are distributed across different regulatory contexts. The heatmap visualizes the number of unique KEGG Orthology (KO) identifiers at the intersection of each sample and each reference agency. This yields a matrix of annotation co-occurrence counts that can highlight where specific samples have higher KO annotation density associated with compounds monitored by specific agencies.
Data and Inputs
- Primary data source: BioRemPP
- Key columns:
sample– identifier for each biological samplereferenceAG– identifier for the regulatory or scientific agency (e.g., WFD, CONAMA, EPC)ko– KEGG Orthology identifier associated with the annotated function- Accepted format: semicolon-delimited text table (
.txtor.csv) - Entity of interest: unique KO identifiers counted per
(sample, referenceAG)pair
Analytical Workflow
-
Data Loading
The primary results table produced by the BioRemPP analysis is loaded into memory. -
Filtering
The dataset is filtered to retain only complete entries that contain valid values forsample,referenceAG, andko. Rows with missing or invalid entries in any of these fields are discarded. -
Aggregation The filtered data is grouped by each unique
(sample, referenceAG)pair. Within each group, the number of distinct KO identifiers is computed. This count reflects the KO annotation co-occurrence count for that specific sample–agency combination. -
Matrix Construction
The aggregated data is pivoted to construct a 2D matrix where: - rows represent Reference Agencies (
referenceAG), - columns represent Samples, and
-
each cell value corresponds to the unique KO count for that sample–agency pair.
-
Rendering The resulting matrix is rendered as an interactive heatmap, where color intensity is proportional to the KO count. A color bar indicates the quantitative scale of KO annotation counts.
How to Read the Plot
-
Y-axis (Rows)
Represents the different Reference Agencies included in the analysis. -
X-axis (Columns)
Represents the individual Samples. -
Cell Color and Optional Labels The color intensity of each cell (and, optionally, the numeric label within it) indicates the count of unique KOs co-annotated for that specific sample–agency combination. Darker or warmer colors correspond to higher KO counts for that sample-agency pair.
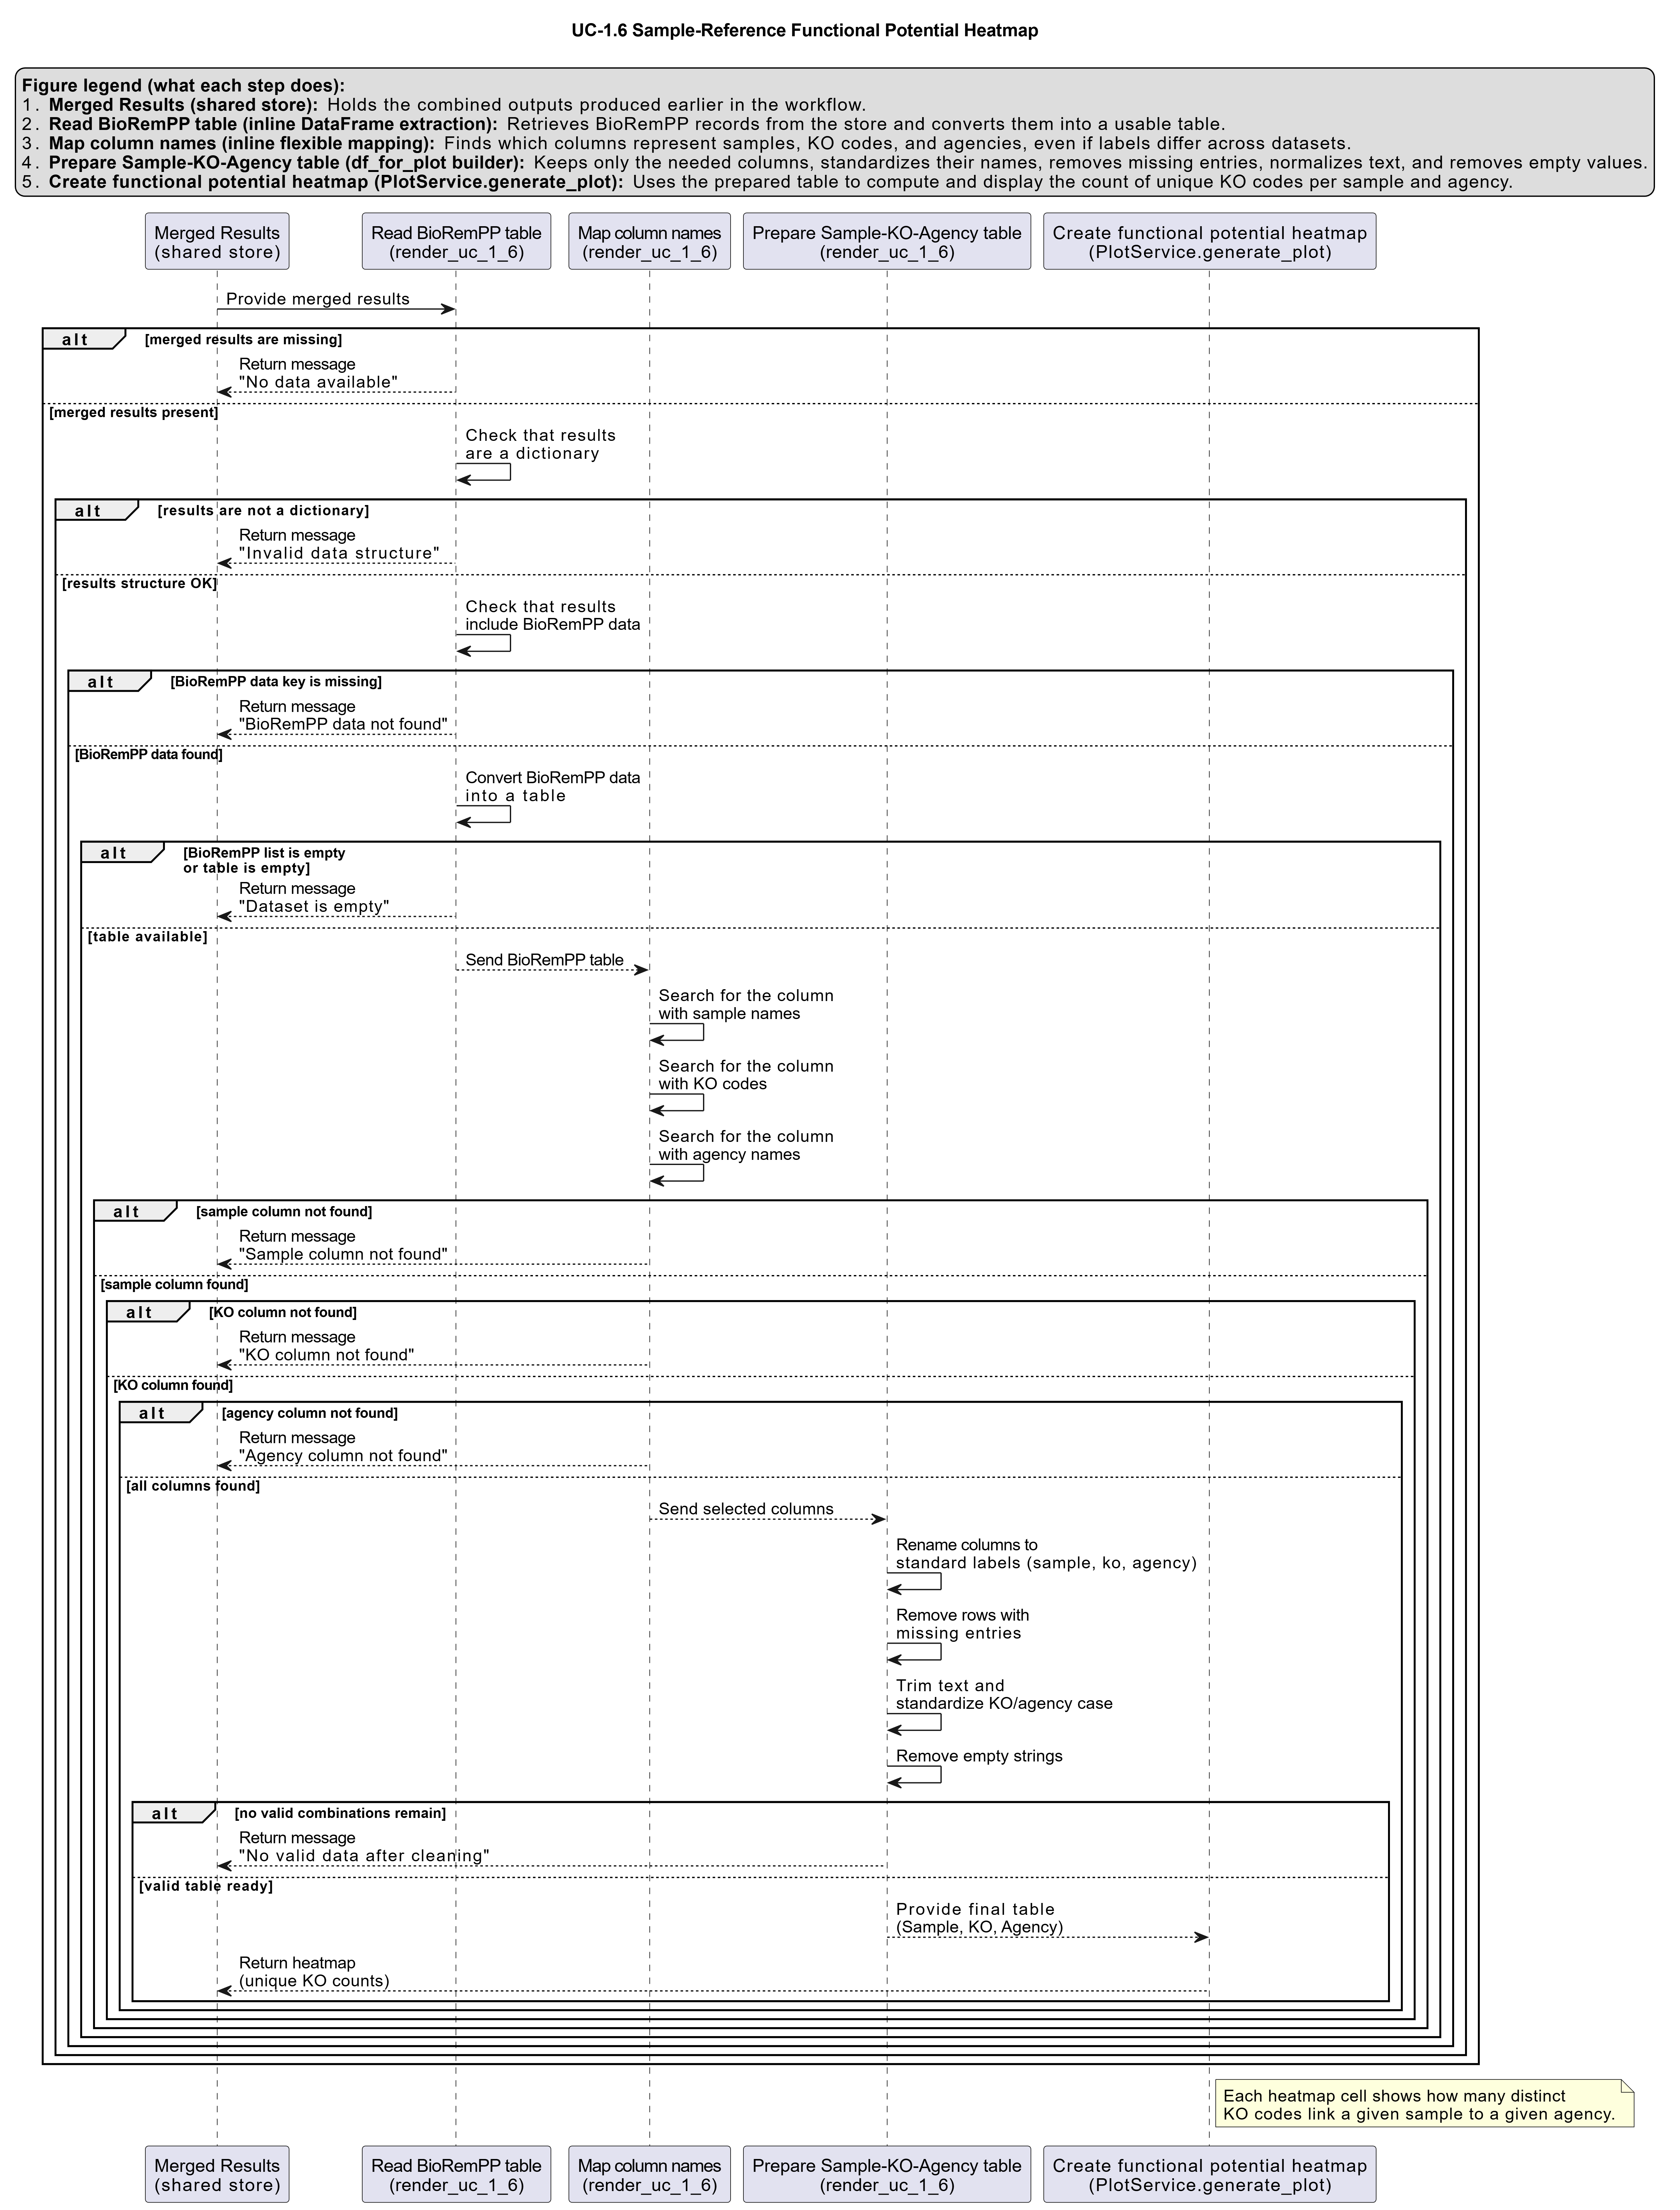
Representative Output
The image below illustrates a representative output generated by this use case using the example dataset.
Click on the image to enlarge and explore details.
Interpretation and Key Messages
-
Annotation Hotspots Brightly colored cells indicate a higher count of unique KOs at the intersection of a sample and a regulatory agency context. This suggests greater annotation overlap and may indicate functional relevance worth exploring; it does not confirm degradation capability without experimental evidence.
-
Agency-Level Patterns Rows with consistently high values may indicate that an agency's target compounds are associated with broadly distributed KO annotations across samples. This pattern may reflect the commonality of pathways involved in processing those compounds within the annotated dataset.
-
Sample-Level Profiles Columns with consistently high values may suggest a sample with broad KO annotation coverage across multiple regulatory contexts. Columns with elevated values in only a few rows may indicate more context-specific annotation coverage. These are annotation patterns and do not confirm metabolic breadth or specialization.
Reproducibility and Assumptions
-
Input Format
The analysis assumes a semicolon-delimited table containing at least the columnssample,referenceAG, andko. -
Co-occurrence Definition
A valid link between a sample, a reference agency, and a KO is inferred from their co-occurrence in the same row of the input table. -
Uniqueness Handling
For each(sample, referenceAG)pair, the final value reflects the count of unique KO identifiers, not the total number of occurrences. Multiple rows containing the same KO for the same sample–agency pair are collapsed into a single count. -
Annotation Interpretation KO counts reflect annotation co-occurrence, not confirmed functional potential. The heatmap does not distinguish between differences in expression levels, gene copy number, or kinetic efficiency, which are addressed in other parts of the analytical framework or in downstream experimental validation.
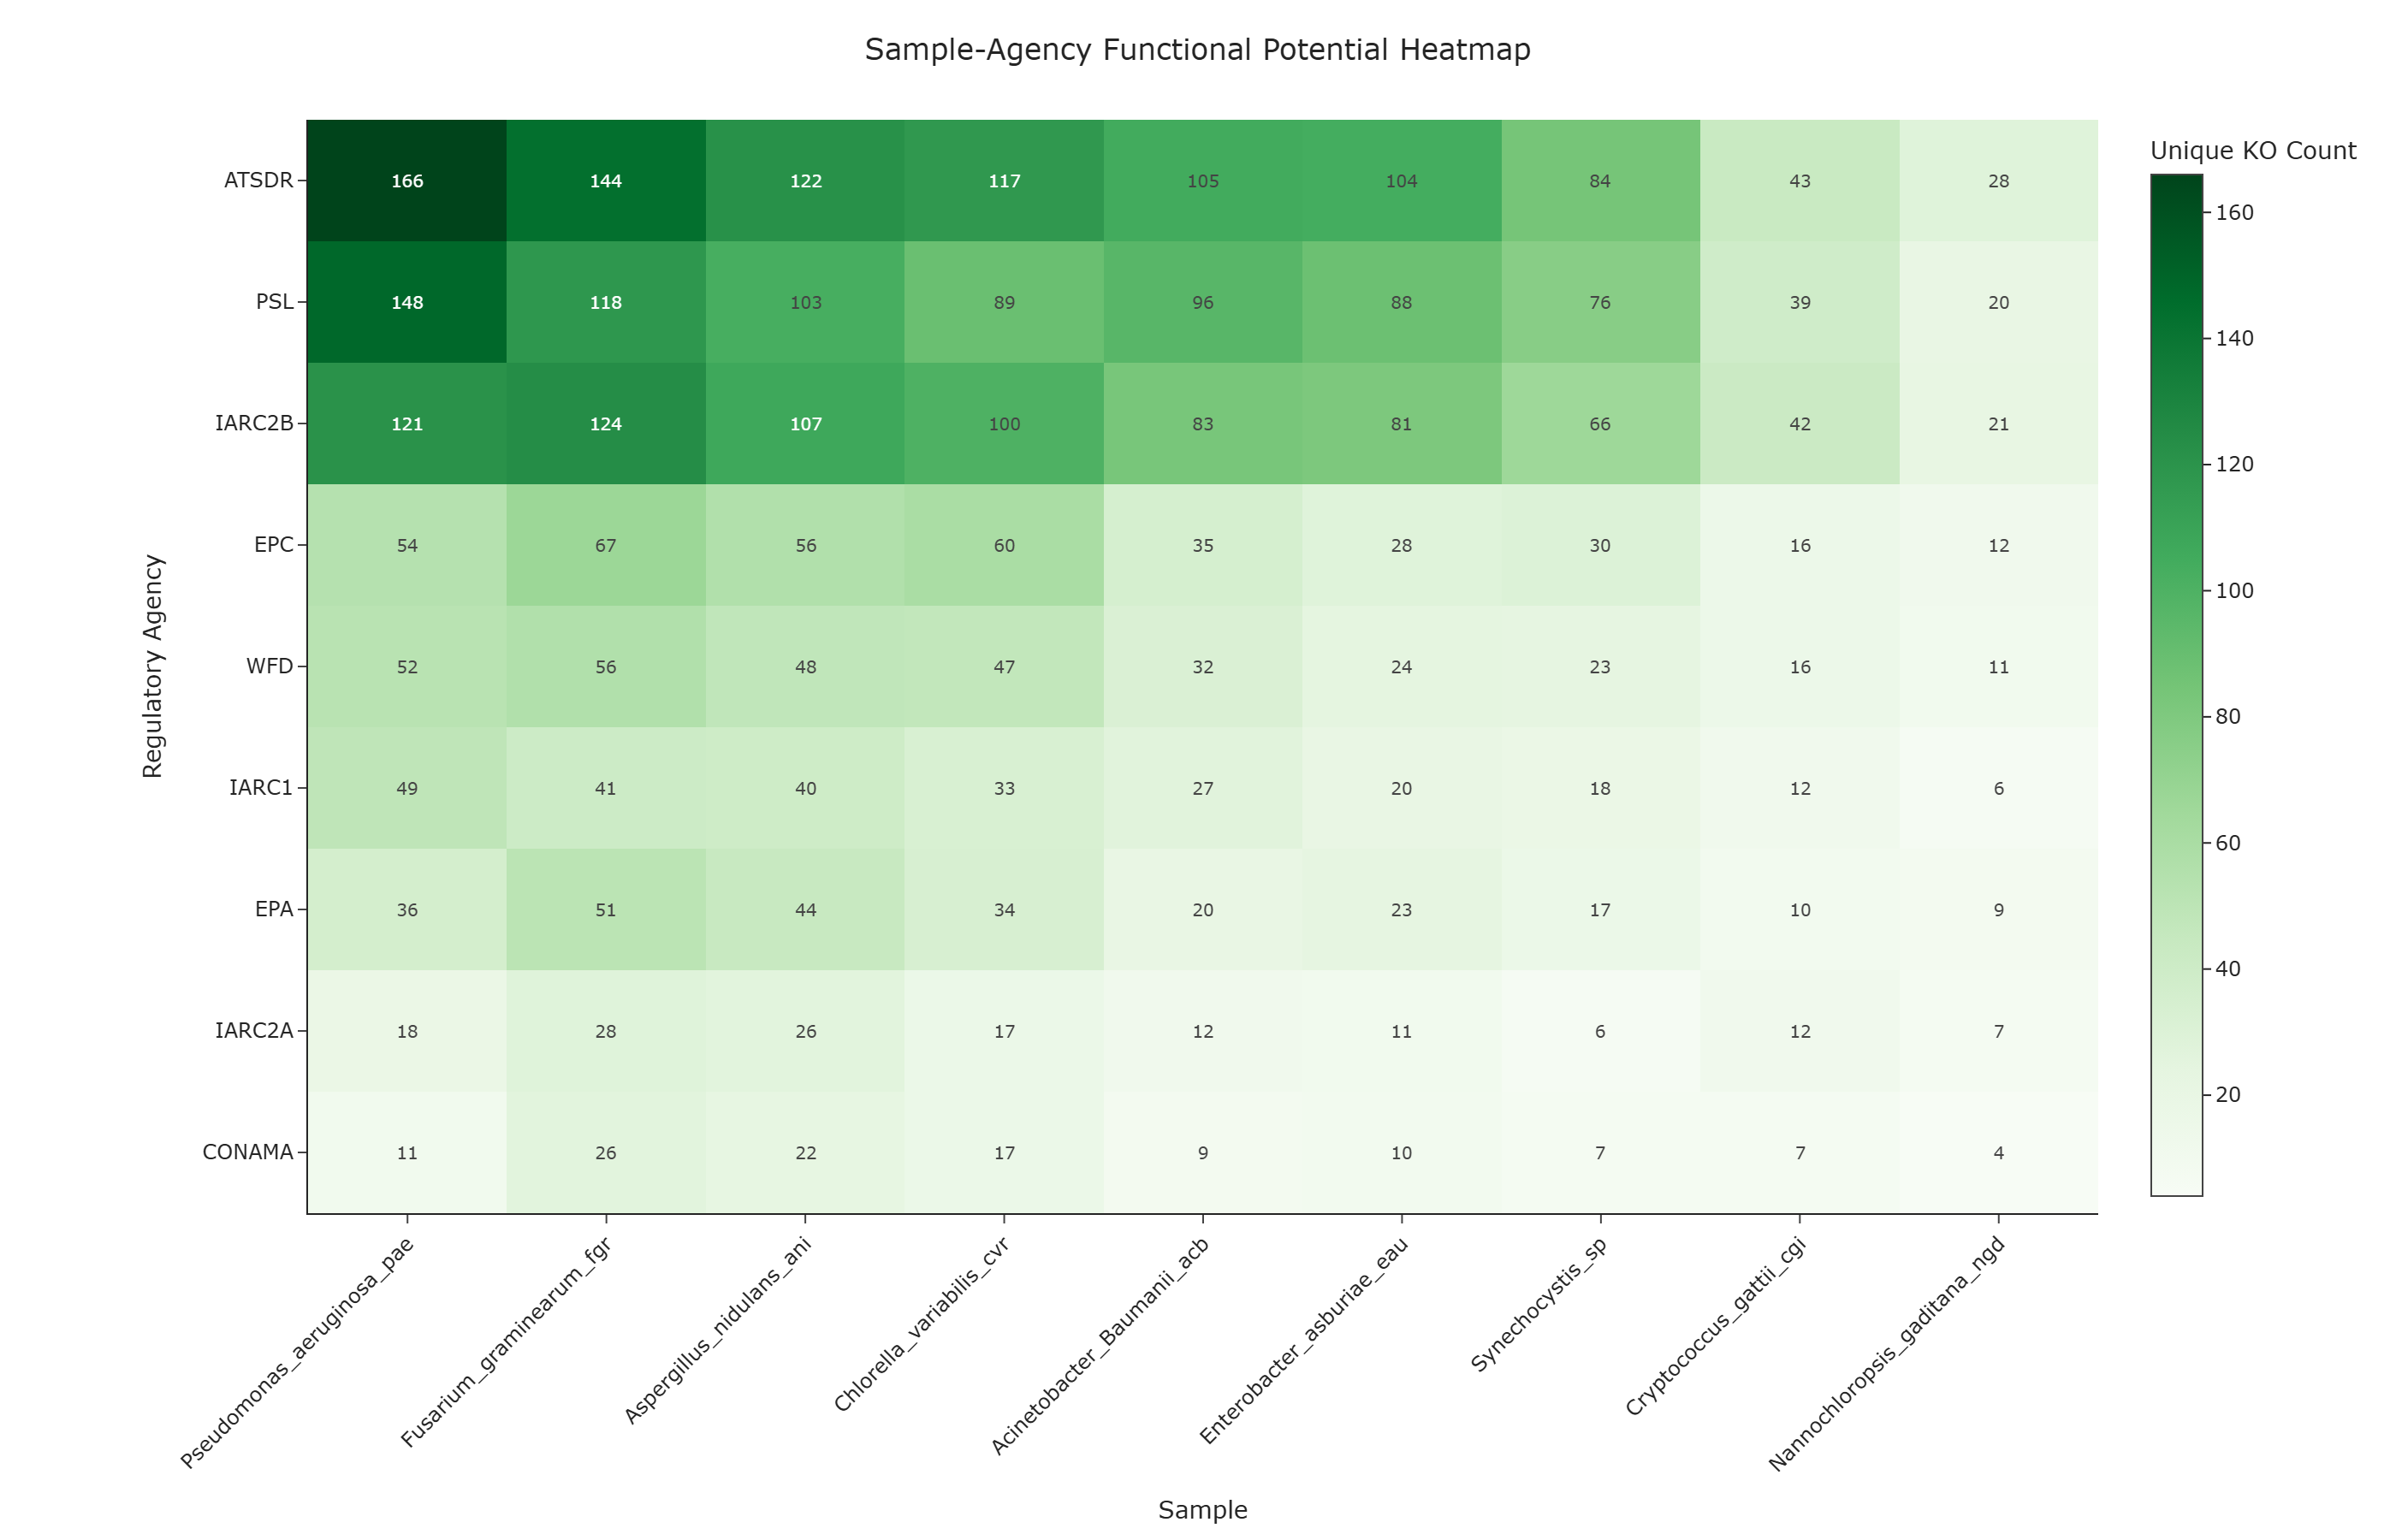
Activity diagram of the use case
Click on the image to enlarge and explore details.