UC-2.1 — Ranking of Sample Functional Richness Across Databases
Module: 2 – Exploratory Analysis: Ranking the Functional Potential of Samples and Compounds
Visualization type: Interactive vertical bar chart (ranked unique KO counts per sample)
Primary inputs: BioRemPP, HADEG, and KEGG results tables with sample-level KO annotations
Primary outputs: Ranked list of samples by functional richness (unique KO count) for each database
Scientific Question and Rationale
Question: How does the ranking of functional richness for each sample change when viewed through the lens of different annotation databases (BioRemPP, HADEG, KEGG)?
This use case enables a direct comparison of the KO annotation count of each biological sample across multiple annotation sources. By allowing the user to switch between BioRemPP, HADEG, and KEGG, the horizontal bar chart reveals how many unique KEGG Orthology (KO) identifiers are associated with each sample in each database. This comparative view can help assess the extent to which a sample's KO annotation ranking depends on the chosen reference source.
Data and Inputs
- Primary data sources:
- BioRemPP results table
- HADEG results table
- KEGG results table
- Key columns (per selected database):
sample– identifier for each biological samplekoorGene– KEGG Orthology identifier (or equivalent column used to store KO IDs)- Accepted format: semicolon-delimited text tables (
.txtor.csv) - Entity of interest: unique KO identifiers counted per sample for the selected database
Analytical Workflow
-
Database Selection
The user selects one of the available data sources (e.g., "BioRemPP", "HADEG", or "KEGG") via an interactive dropdown menu. -
Dynamic Data Loading
Based on the selected database, the corresponding raw results table is loaded and parsed from its semicolon-delimited format. -
Data Processing and Aggregation
The loaded data is filtered to remove invalid or incomplete entries (e.g., missingsampleor KO identifier). For the selected database, the script: - identifies the appropriate KO column (
koorGene), and -
calculates the number of distinct KO identifiers associated with each unique
sample. -
Rendering and Sorting
The aggregated counts are visualized as a vertical bar chart: - each bar represents a Sample,
- bar length shows the unique KO count, and
- bars are automatically sorted (typically ascending or descending) to create an intuitive ranking from lower to higher KO annotation count.
How to Read the Plot
-
Dropdown Menu
Use the dropdown control to switch between the BioRemPP, HADEG, and KEGG datasets. The chart updates dynamically based on the selected source. -
X-axis (Horizontal Axis)
Represents individual Samples (one bar per sample). -
Y-axis (Vertical Axis)
Represents the count of unique KOs associated with each sample in the selected database. -
Bar Length and Labels
The length of each bar reflects the total number of unique KOs for that sample. Optional numeric labels at the end of the bars explicitly state the KO count, supporting precise comparisons.
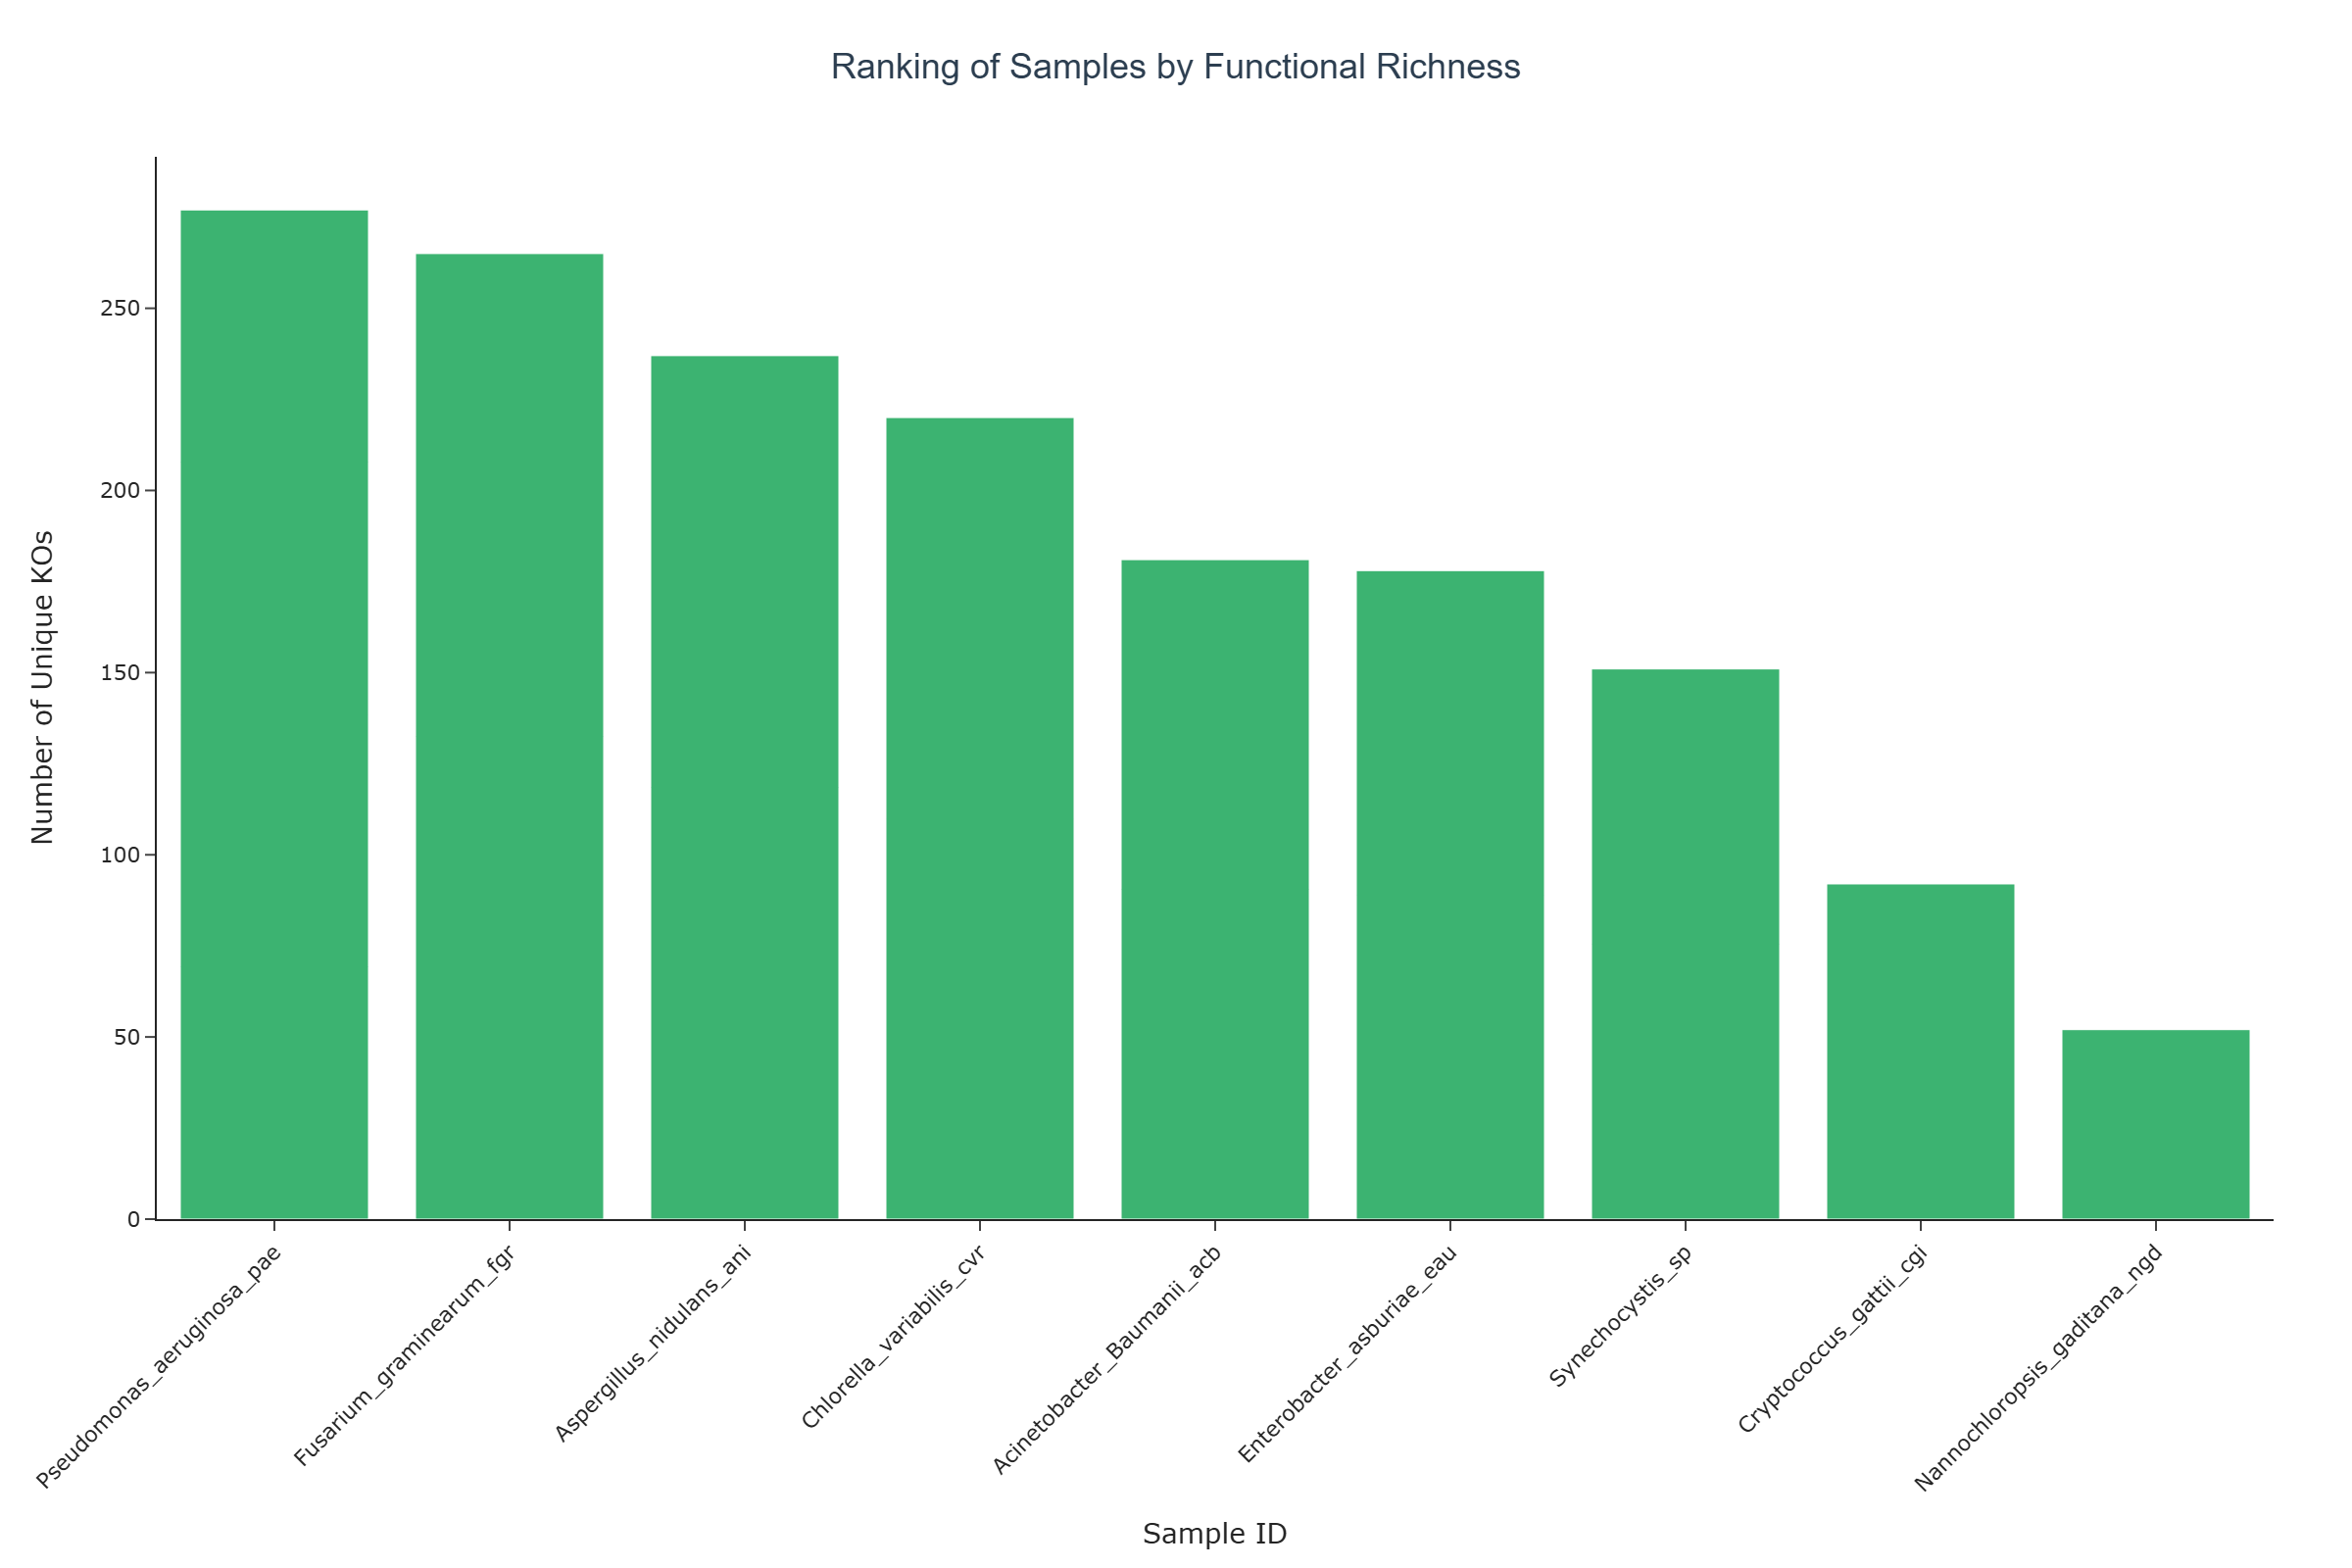
Representative Output
The image below illustrates a representative output generated by this use case using the example dataset.
Click on the image to enlarge and explore details.
Interpretation and Key Messages
-
Comparative Ranking Across Databases By switching between databases, users can observe how each sample's ranking changes. A sample that ranks highly in HADEG but lower in KEGG may reflect HADEG's more focused annotation scope rather than confirmed specialization in a particular pathway.
-
Broad vs. Narrow Annotation Profiles Samples that consistently rank near the top across all three databases show broad KO annotation coverage regardless of source. Those whose ranks vary significantly may have KO profiles that are more selectively captured by certain databases, warranting further investigation of the annotation differences.
-
Assessing Database Scope Differences in rankings across BioRemPP, HADEG, and KEGG can help characterize the inherent scope, curation strategy, and thematic focus of each annotation source. This can inform decisions about which database is most appropriate for a given analytical question.
Reproducibility and Assumptions
-
Input Format
The analysis assumes semicolon-delimited tables for each database, each containing at leastsampleand eitherkoorGenecolumns. -
KO Column Handling
The script dynamically detects whether KO identifiers are stored in akoorGenecolumn and treats both as equivalent sources of KO IDs. -
Uniqueness Definition KO annotation count per sample is defined as the count of unique KO identifiers. Multiple occurrences of the same KO in the same sample (e.g., linked to several genes or compounds) are counted only once.
-
Comparability Across Databases
Rankings are based on direct comparisons of unique KO counts within each database. Cross-database differences in curation depth, pathway coverage, and update cycles can influence KO diversity and should be considered when interpreting shifts in rank.
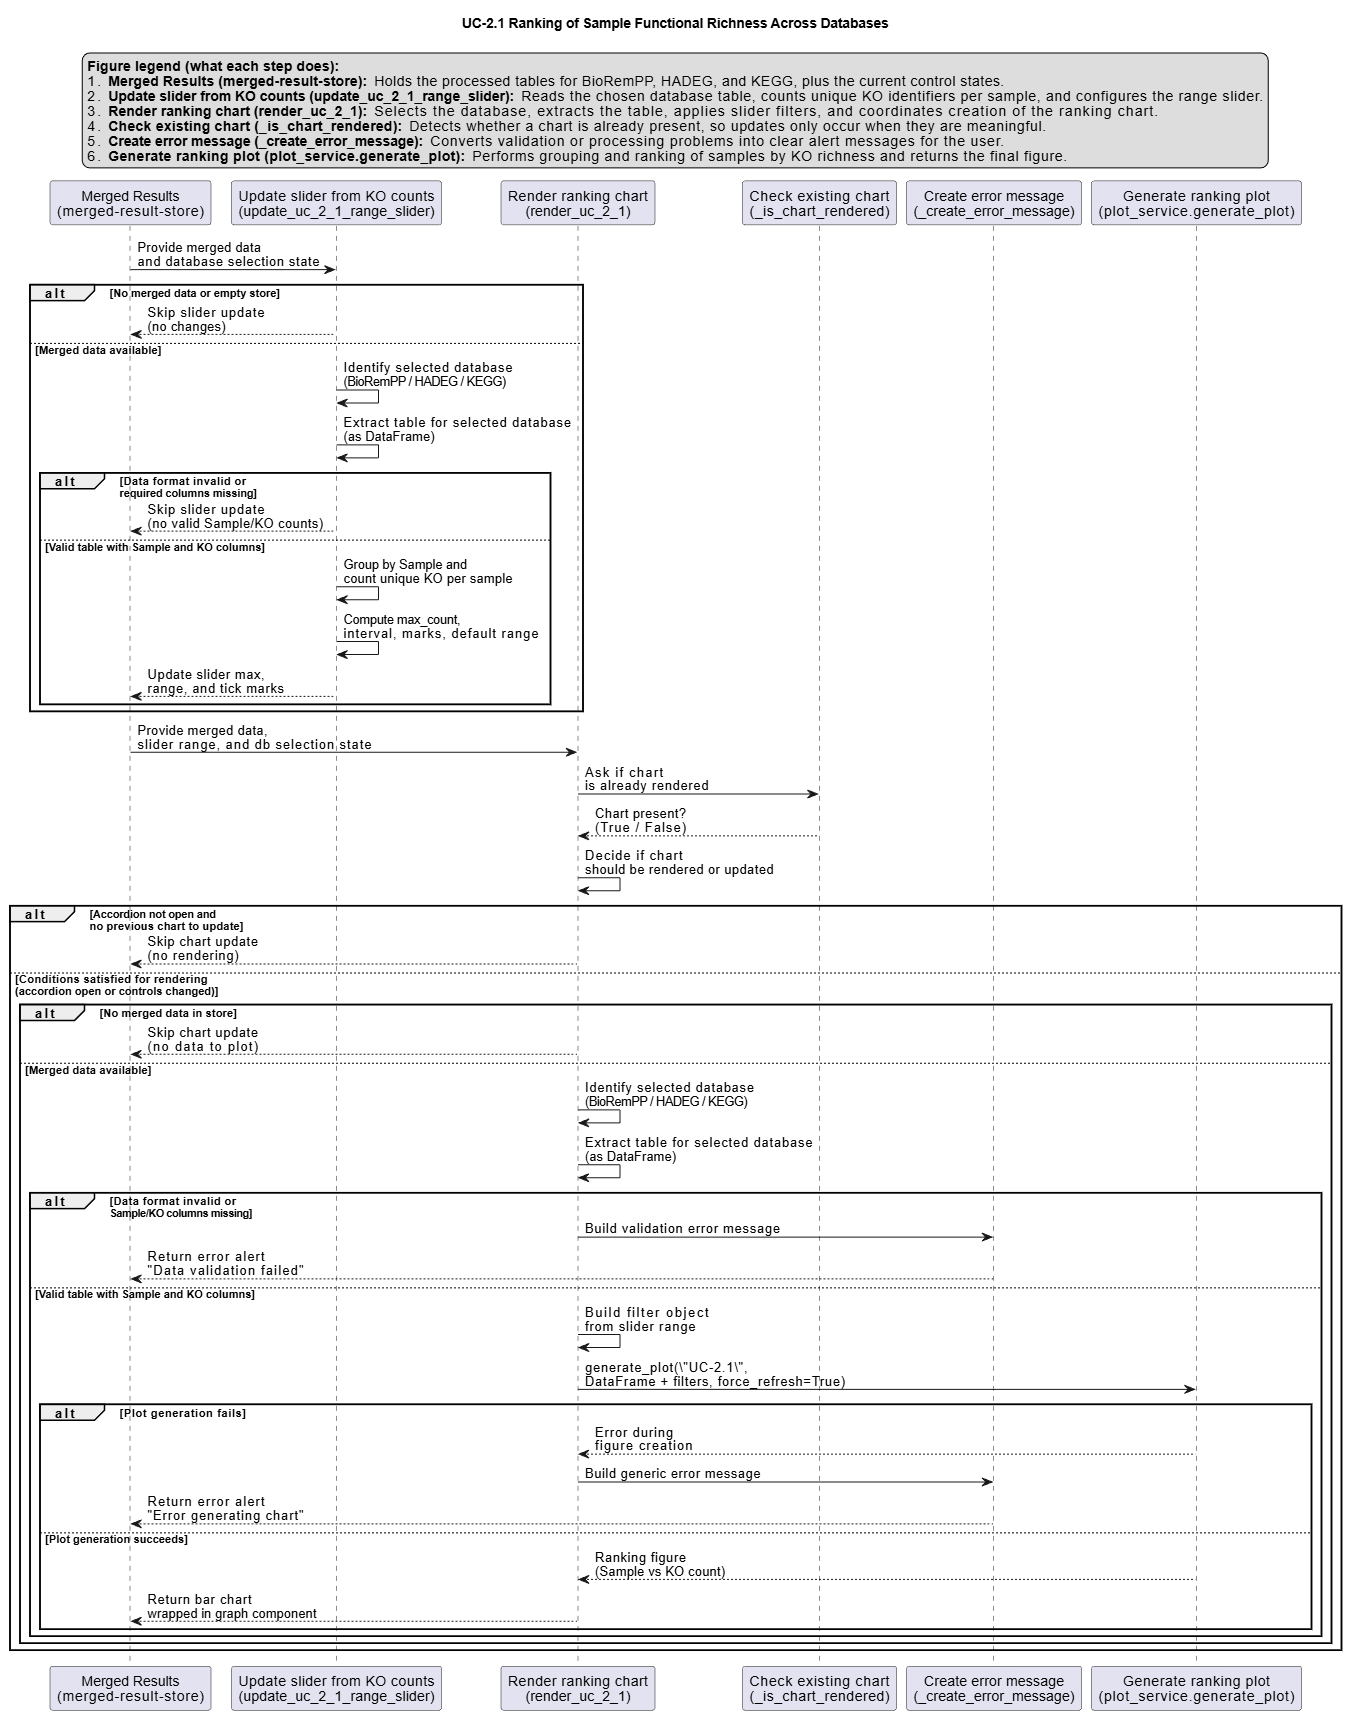
Activity diagram of the use case
Click on the image to enlarge and explore details.