UC-2.3 — Ranking of Compound Richness by Sample per Chemical Class
Module: 2 – Exploratory Analysis: Ranking the Functional Potential of Samples and Compounds
Visualization type: Interactive bar chart (unique sample count per compound, by chemical class)
Primary inputs: BioRemPP results table with sample, compoundclass, and compoundname columns
Primary outputs: Ranked list of compounds by number of interacting samples, within a selected chemical class
Scientific Question and Rationale
Question: Within a specific chemical class, which compounds are co-annotated with the widest range of biological samples in the dataset, and what hypotheses might this pattern suggest about shared functional potential?
This use case ranks compounds according to how many distinct biological samples are co-annotated with them, within a user-selected chemical class. By focusing on the number of unique samples per compound, the visualization highlights which compounds show the broadest sample co-occurrence within the selected category.
Data and Inputs
- Primary data source:
BioRemPP_Results.xlsx or BioRemPP_Results.csv - Key columns:
sample– identifier for each biological samplecompoundclass– categorical label defining the chemical class (e.g., Aromatics, Chlorinated, Alkanes)compoundname– name of the chemical compound- Accepted format: semicolon-delimited text table (
.txtor.csv) - Entities of interest: compounds, grouped by chemical class, with counts of unique co-annotated samples
Analytical Workflow
-
User Selection
The user selects a specificcompoundclassfrom an interactive dropdown menu. -
Dynamic Filtering
The primary results table (BioRemPP_Results.xlsx or BioRemPP_Results.csv) is filtered to retain only rows corresponding to the selectedcompoundclass. All downstream calculations are performed on this subset. -
Aggregation The filtered data is grouped by each unique
compoundname. Within each group, the number of distinct samples co-annotated with that compound is computed (e.g., usingnunique()on thesamplecolumn). This yields a per-compound measure of sample co-occurrence breadth within the dataset. -
Sorting and Rendering
The aggregated results (compound vs. unique sample count) are sorted in descending order and rendered as a bar chart: - one axis lists Compounds within the selected class,
- the other axis represents the count of unique samples that interact with each compound, and
- bar height/length is proportional to the unique sample count.
How to Read the Plot
-
Dropdown Menu
Use the dropdown to select the Chemical Class (compoundclass) to analyze. The plot updates automatically to show only compounds within that class. -
Compound Axis
One axis lists individual Compounds belonging to the selected chemical class. -
Sample Count Axis
The other axis represents the count of unique samples associated with each compound. -
Bar Height and Labels The height (or length) of each bar, along with optional numeric labels, indicates the total number of unique samples co-annotated with that compound. Taller bars correspond to compounds with a larger number of co-annotated samples in the dataset.
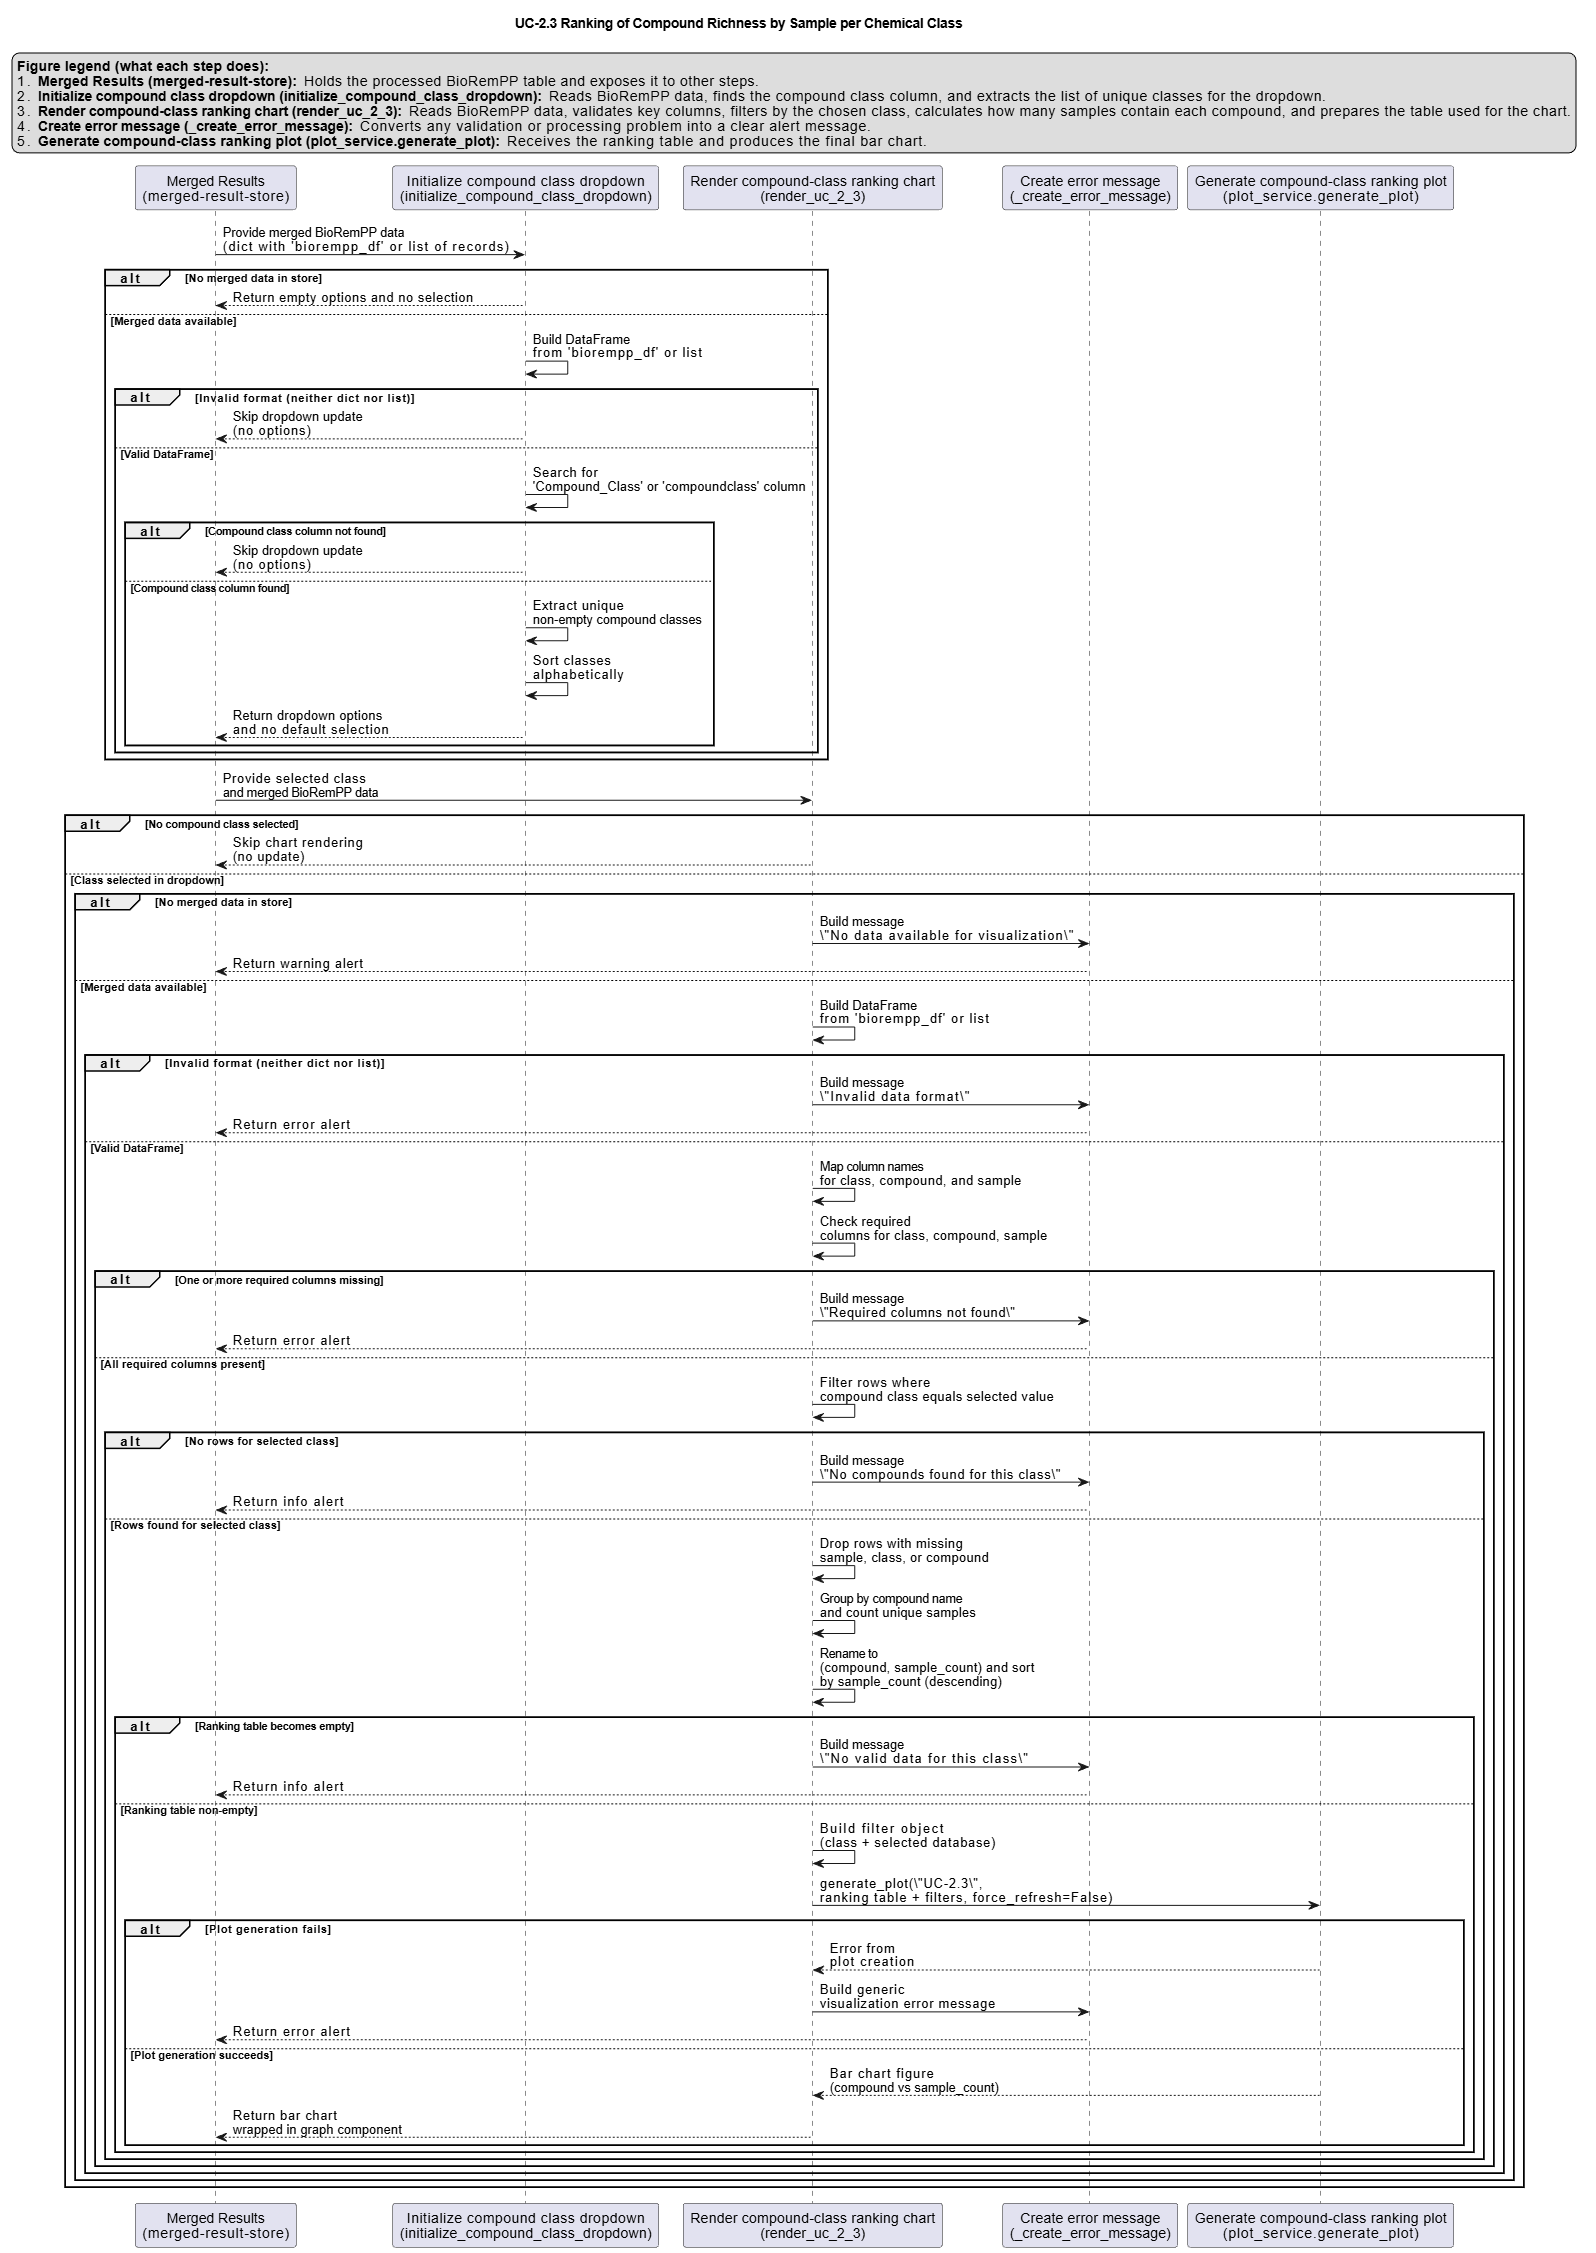
Representative Output
The image below illustrates a representative output generated by this use case using the example dataset.
Click on the image to enlarge and explore details.
Interpretation and Key Messages
-
Broad Sample Co-occurrence Compounds with taller bars are co-annotated with a greater number of samples in the dataset. This pattern may suggest widespread annotation coverage and can serve as a hypothesis-generating signal — for example, about shared functional potential across sources — but does not establish causality or confirm biotransformation activity.
-
Narrow Association Profiles Compounds with shorter bars — especially those with a unique sample count of 1 — are co-annotated with only a few or a single sample. This may reflect a more limited annotation overlap or a narrower co-occurrence pattern in the dataset, rather than confirmed rare metabolic capability.
-
Comparing Chemical Classes By switching the selected
compoundclassin the dropdown, users can compare co-occurrence patterns across different chemical classes. This can help identify whether certain classes show broader or more concentrated sample co-occurrence, generating hypotheses about functional coverage differences across compound categories.
Reproducibility and Assumptions
-
Input Format
The analysis assumes a semicolon-delimited table containing at least the columnssample,compoundclass, andcompoundname. -
Uniqueness Definition
The ranking is based on the count of unique samples per compound. If a single sample interacts with a compound multiple times (e.g., through different genes, pathways, or reactions), it is still counted only once for that compound. -
Class-Specific Context
All rankings and interpretations are conditional on the selected chemical class. A compound may appear highly interactive within one class but absent in another simply because it is not annotated under that class. -
Sampling and Annotation Bias
The observed diversity of interacting samples for a given compound is constrained by the composition of the dataset and the completeness of the annotations in BioRemPP.
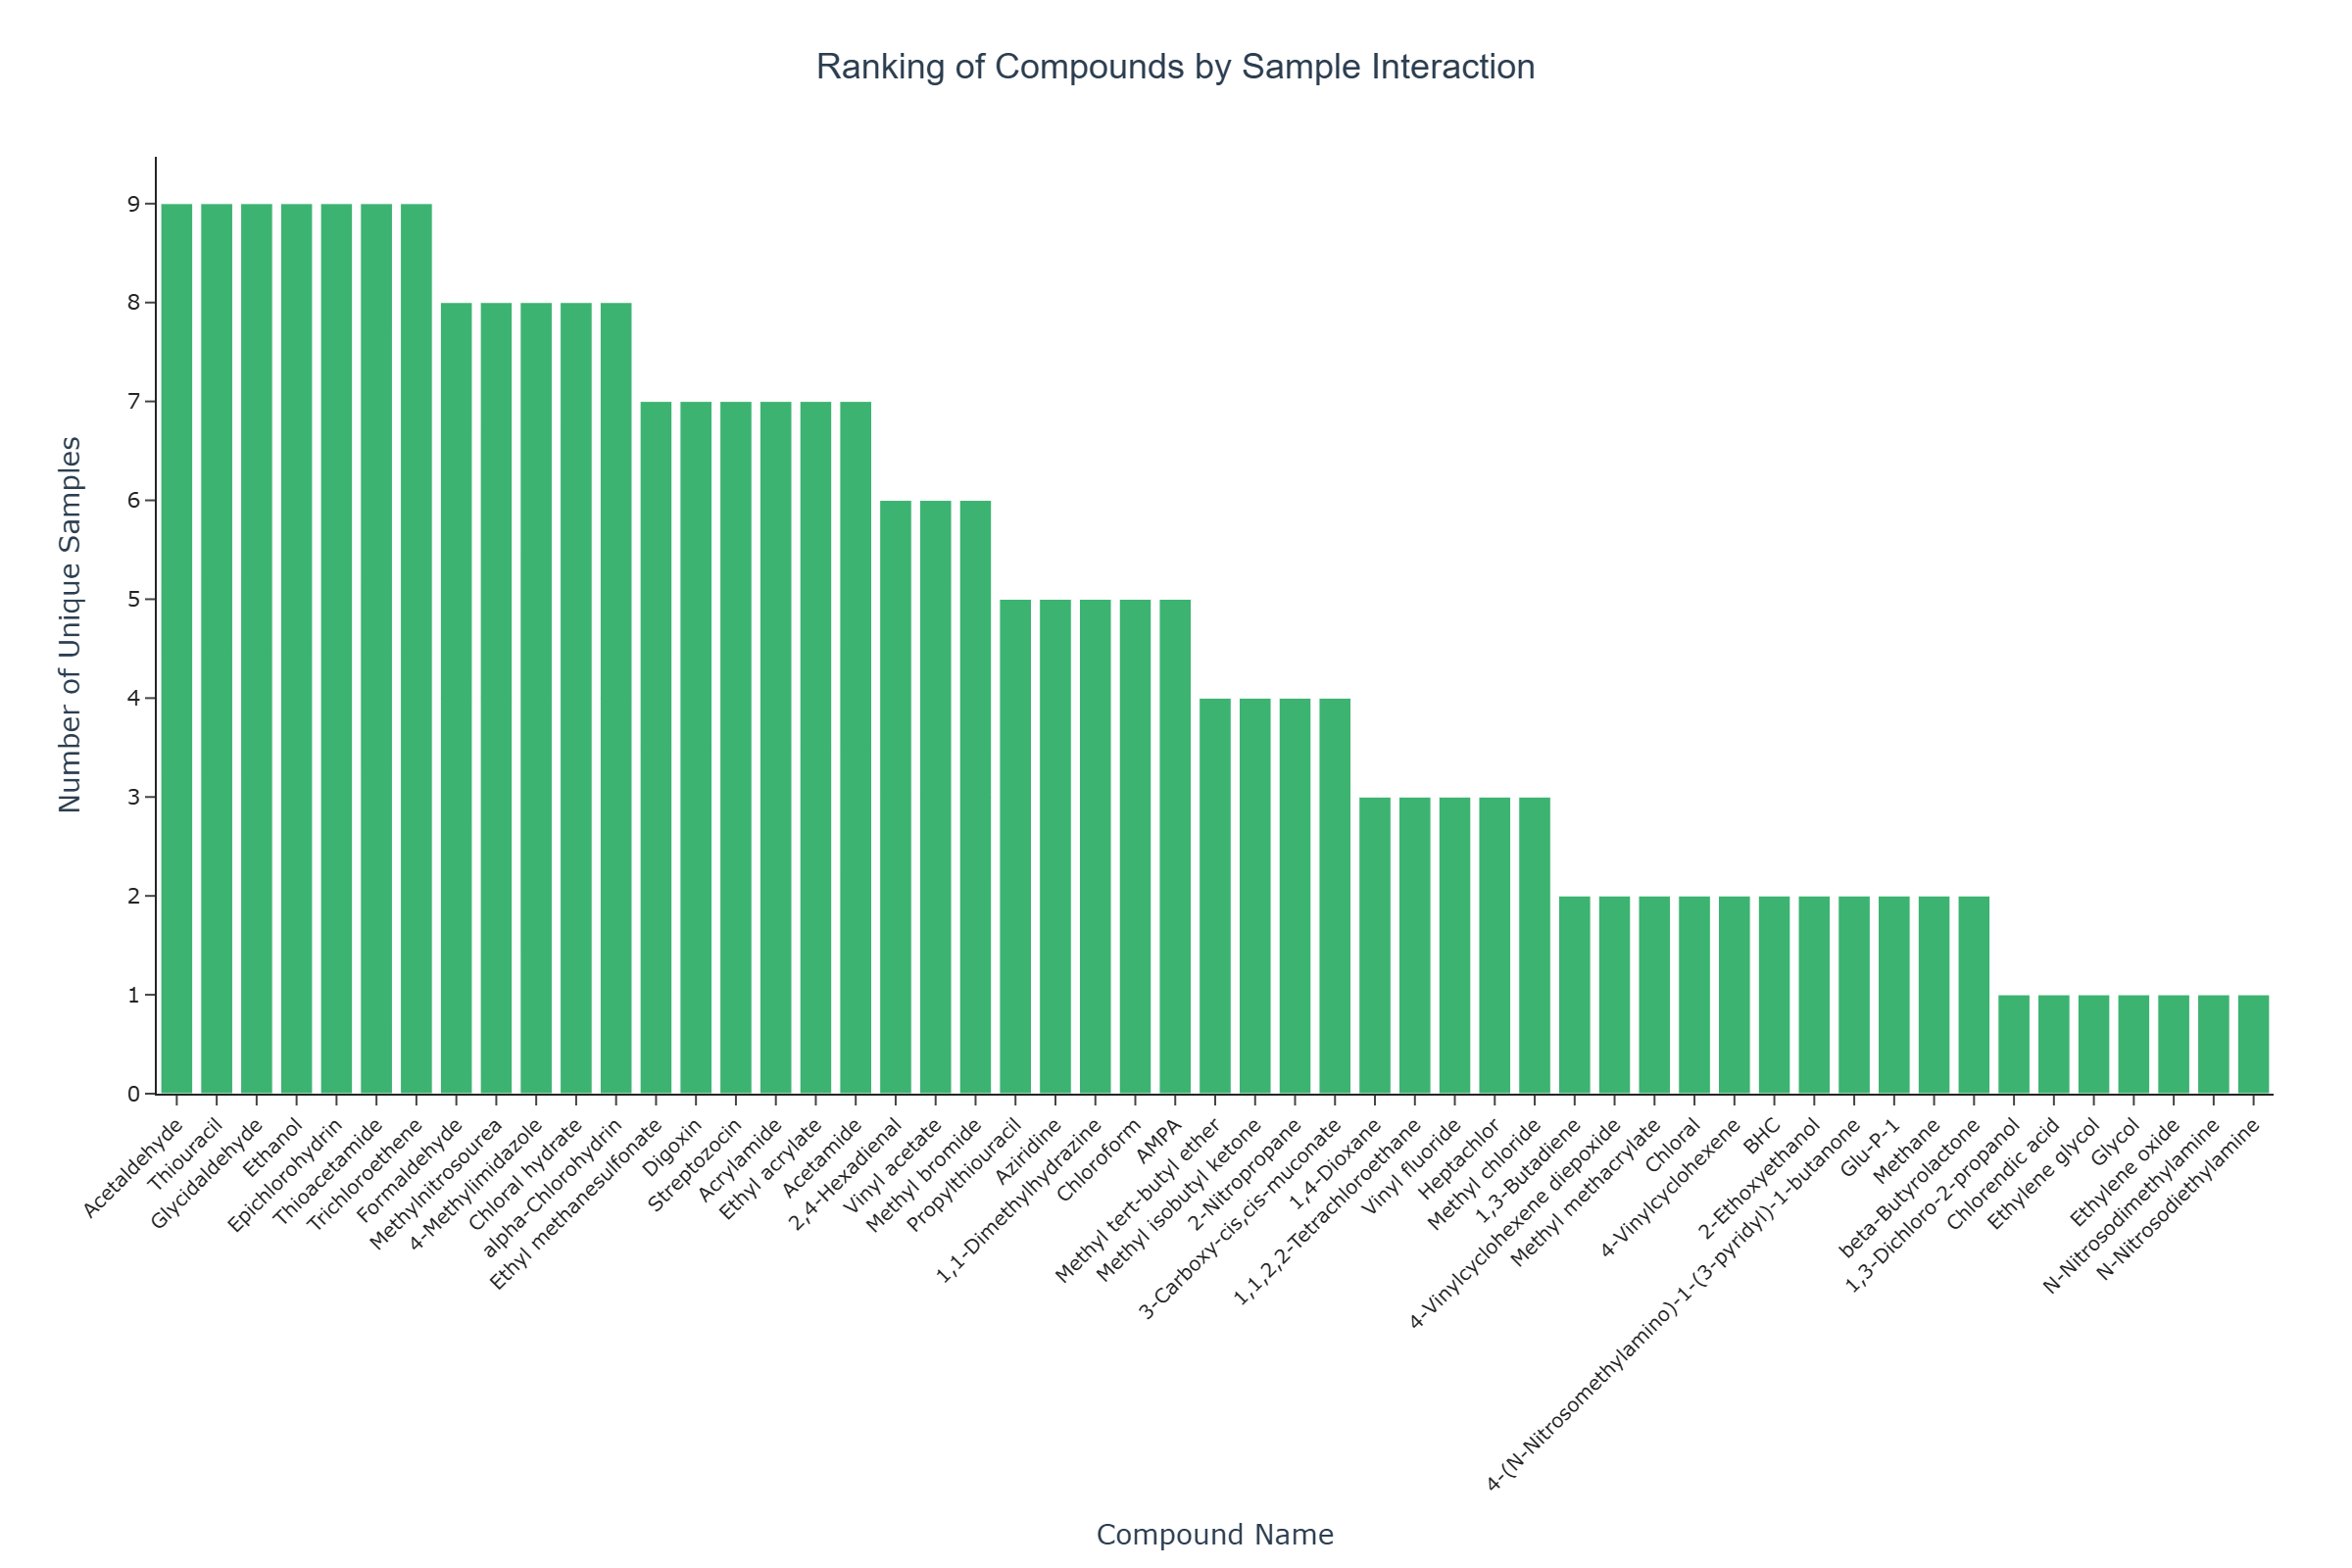
Activity diagram of the use case
Click on the image to enlarge and explore details.