UC-4.1 — Functional Profiling of Samples by Metabolic Pathway
Module: 4 – Functional and Genetic Profiling
Visualization type: Interactive horizontal bar chart (pathway-level KO richness for a selected sample)
Primary inputs: KEGG_Results.xlsx or KEGG_Results.csv (sample–KO–KEGG pathway associations)
Primary outputs: Ranked list of KEGG pathways by unique KO count for a selected sample
Scientific Question and Rationale
Question: What is the KO annotation profile of each sample, as defined by the richness of annotated KOs across its metabolic pathways?
The goal is to characterize, for a given sample, which KEGG metabolic pathways have KO annotations and how many unique KOs are mapped to each pathway. This can yield a pathway-level KO annotation fingerprint for each sample and may provide an interpretable view of its annotated pathway breadth within the KEGG framework (experimental validation required to confirm functional roles).
Data and Inputs
- Primary data source:
KEGG_Results.xlsx or KEGG_Results.csv(semicolon-delimited) - Key columns:
sample– identifier for each biological samplepathname– KEGG pathway name or identifier-
ko– KEGG Orthology (KO) identifier associated with that sample and pathway -
User control:
-
A dropdown menu allowing selection of a single
sampleto be profiled. -
Output structure:
- Bars: KEGG pathways present in the selected sample
- Bar value: count of unique KOs per
(sample, pathname)pair (pathway-level KO richness)
Analytical Workflow
- Sample Selection (User Input)
The user selects a single sample from an interactive dropdown menu. -
All subsequent steps are restricted to this selected
sample. -
Dynamic Filtering
The KEGG results tableKEGG_Results.xlsx or KEGG_Results.csvis loaded and filtered to retain only rows where: sampleequals the selected sample, and-
pathnameandkoare valid and non-missing. -
Aggregation of Pathway-Level KO Richness
- The filtered data is grouped by
pathname. - For each pathway, the number of distinct KO identifiers is computed (e.g., via
nunique()onko). -
This unique KO count is used as a proxy for the functional richness or complexity of that pathway in the selected sample.
-
Sorting and Rendering
- The resulting
(pathname, unique_ko_count)pairs are sorted (typically from lowest to highest or vice versa) to produce an intuitive ranking. - The aggregated data is rendered as a horizontal bar chart, with:
- one bar per KEGG pathway,
- bar length proportional to the unique KO count.
How to Read the Plot
- Dropdown Menu
- Use the menu to choose the Sample whose functional profile you wish to inspect.
-
The bar chart updates automatically when a different sample is selected.
-
Y-axis (Pathways)
- Each entry on the y-axis corresponds to a KEGG Pathway (
pathname) present in the selected sample. -
The set of labels provides a catalogue of pathways with KO annotations for that sample.
-
X-axis (KO Richness)
- The x-axis represents the count of unique KOs associated with each pathway for the selected sample.
-
Larger values indicate a greater diversity of functions contributing to that pathway.
-
Bars (Length and Optional Labels)
- The length of each bar is proportional to the unique KO count for that pathway.
- Optional numeric labels on bars can display the exact KO count, making it straightforward to compare pathway richness quantitatively.
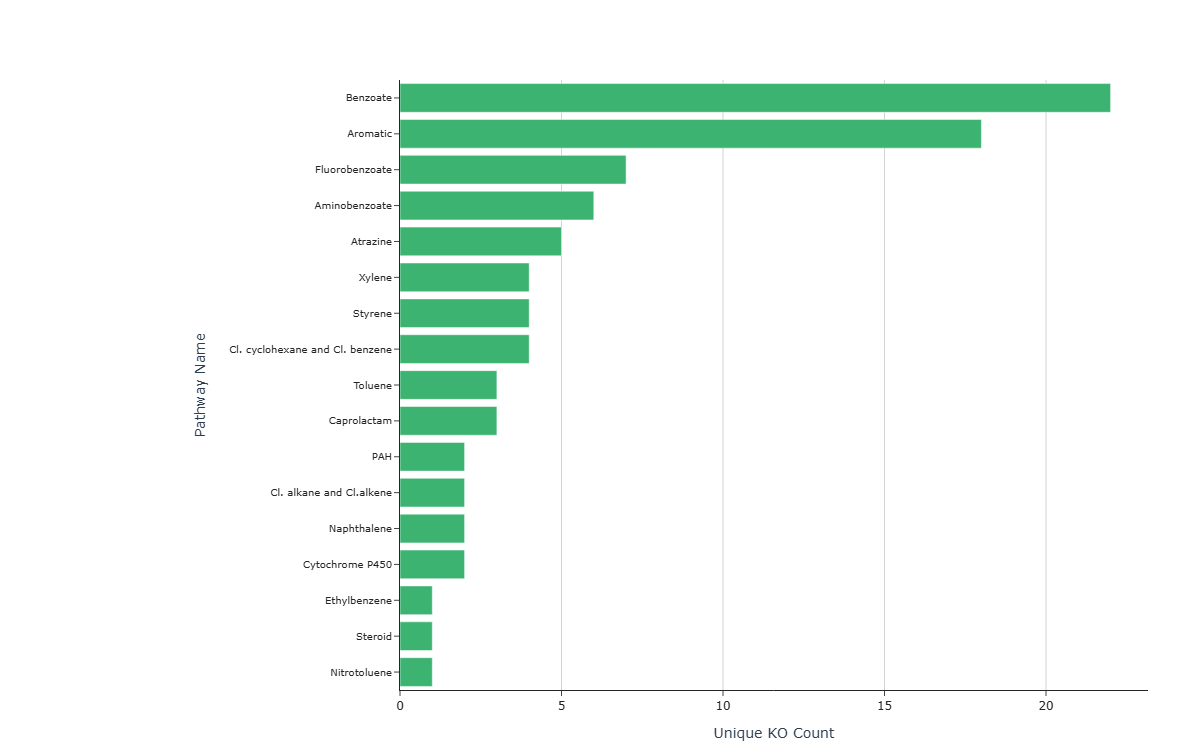
Representative Output
The image below illustrates a representative output generated by this use case using the example dataset.
Click on the image to enlarge and explore details.
Interpretation and Key Messages
- Pathways with High KO Annotation Richness
- The longest bars may identify pathways with the most unique KO annotations for the selected sample.
-
These could represent pathways with broad KO representation in the dataset, which may be worth prioritizing for further investigation (experimental validation required to confirm metabolic activity).
-
Annotation Breadth and Profile Shape
- A sample whose top-ranked pathways are associated with specific compound classes (e.g., hydrocarbons, aromatics, xenobiotics) may have concentrated KO annotation coverage for those domains.
-
Comparing the profiles of different samples may reveal differences in annotated pathway breadth across the dataset.
-
Comparative Profiling Across Samples
- By switching the selected sample in the dropdown, users can compare KO annotation fingerprints.
- These comparisons can support annotation-based hypothesis generation for further experimental investigation.
Reproducibility and Assumptions
- Input Format
The analysis requires a semicolon-delimited KEGG results table with at least: sample,pathname,-
ko. -
Definition of Pathway Richness
- Pathway "richness" is quantified as the count of unique KOs mapped to that pathway for a given sample.
-
This metric is interpreted as a proxy for pathway completeness or complexity, not an absolute measure of biochemical flux or activity.
-
De-duplication and Data Consistency
- Multiple occurrences of the same
(sample, pathname, ko)triplet in the raw data do not increase the richness value; KOs are counted once per pathway per sample. -
Accurate interpretation assumes consistent naming of
sample,pathname, andkoacross the dataset. -
Scope of Inference
- The visualization reflects KO annotation presence, not expression, regulation, or kinetic performance.
- It should be integrated with other BioRemPP layers (e.g., toxicology, regulatory mapping, network analyses) when generating hypotheses for experimental follow-up.
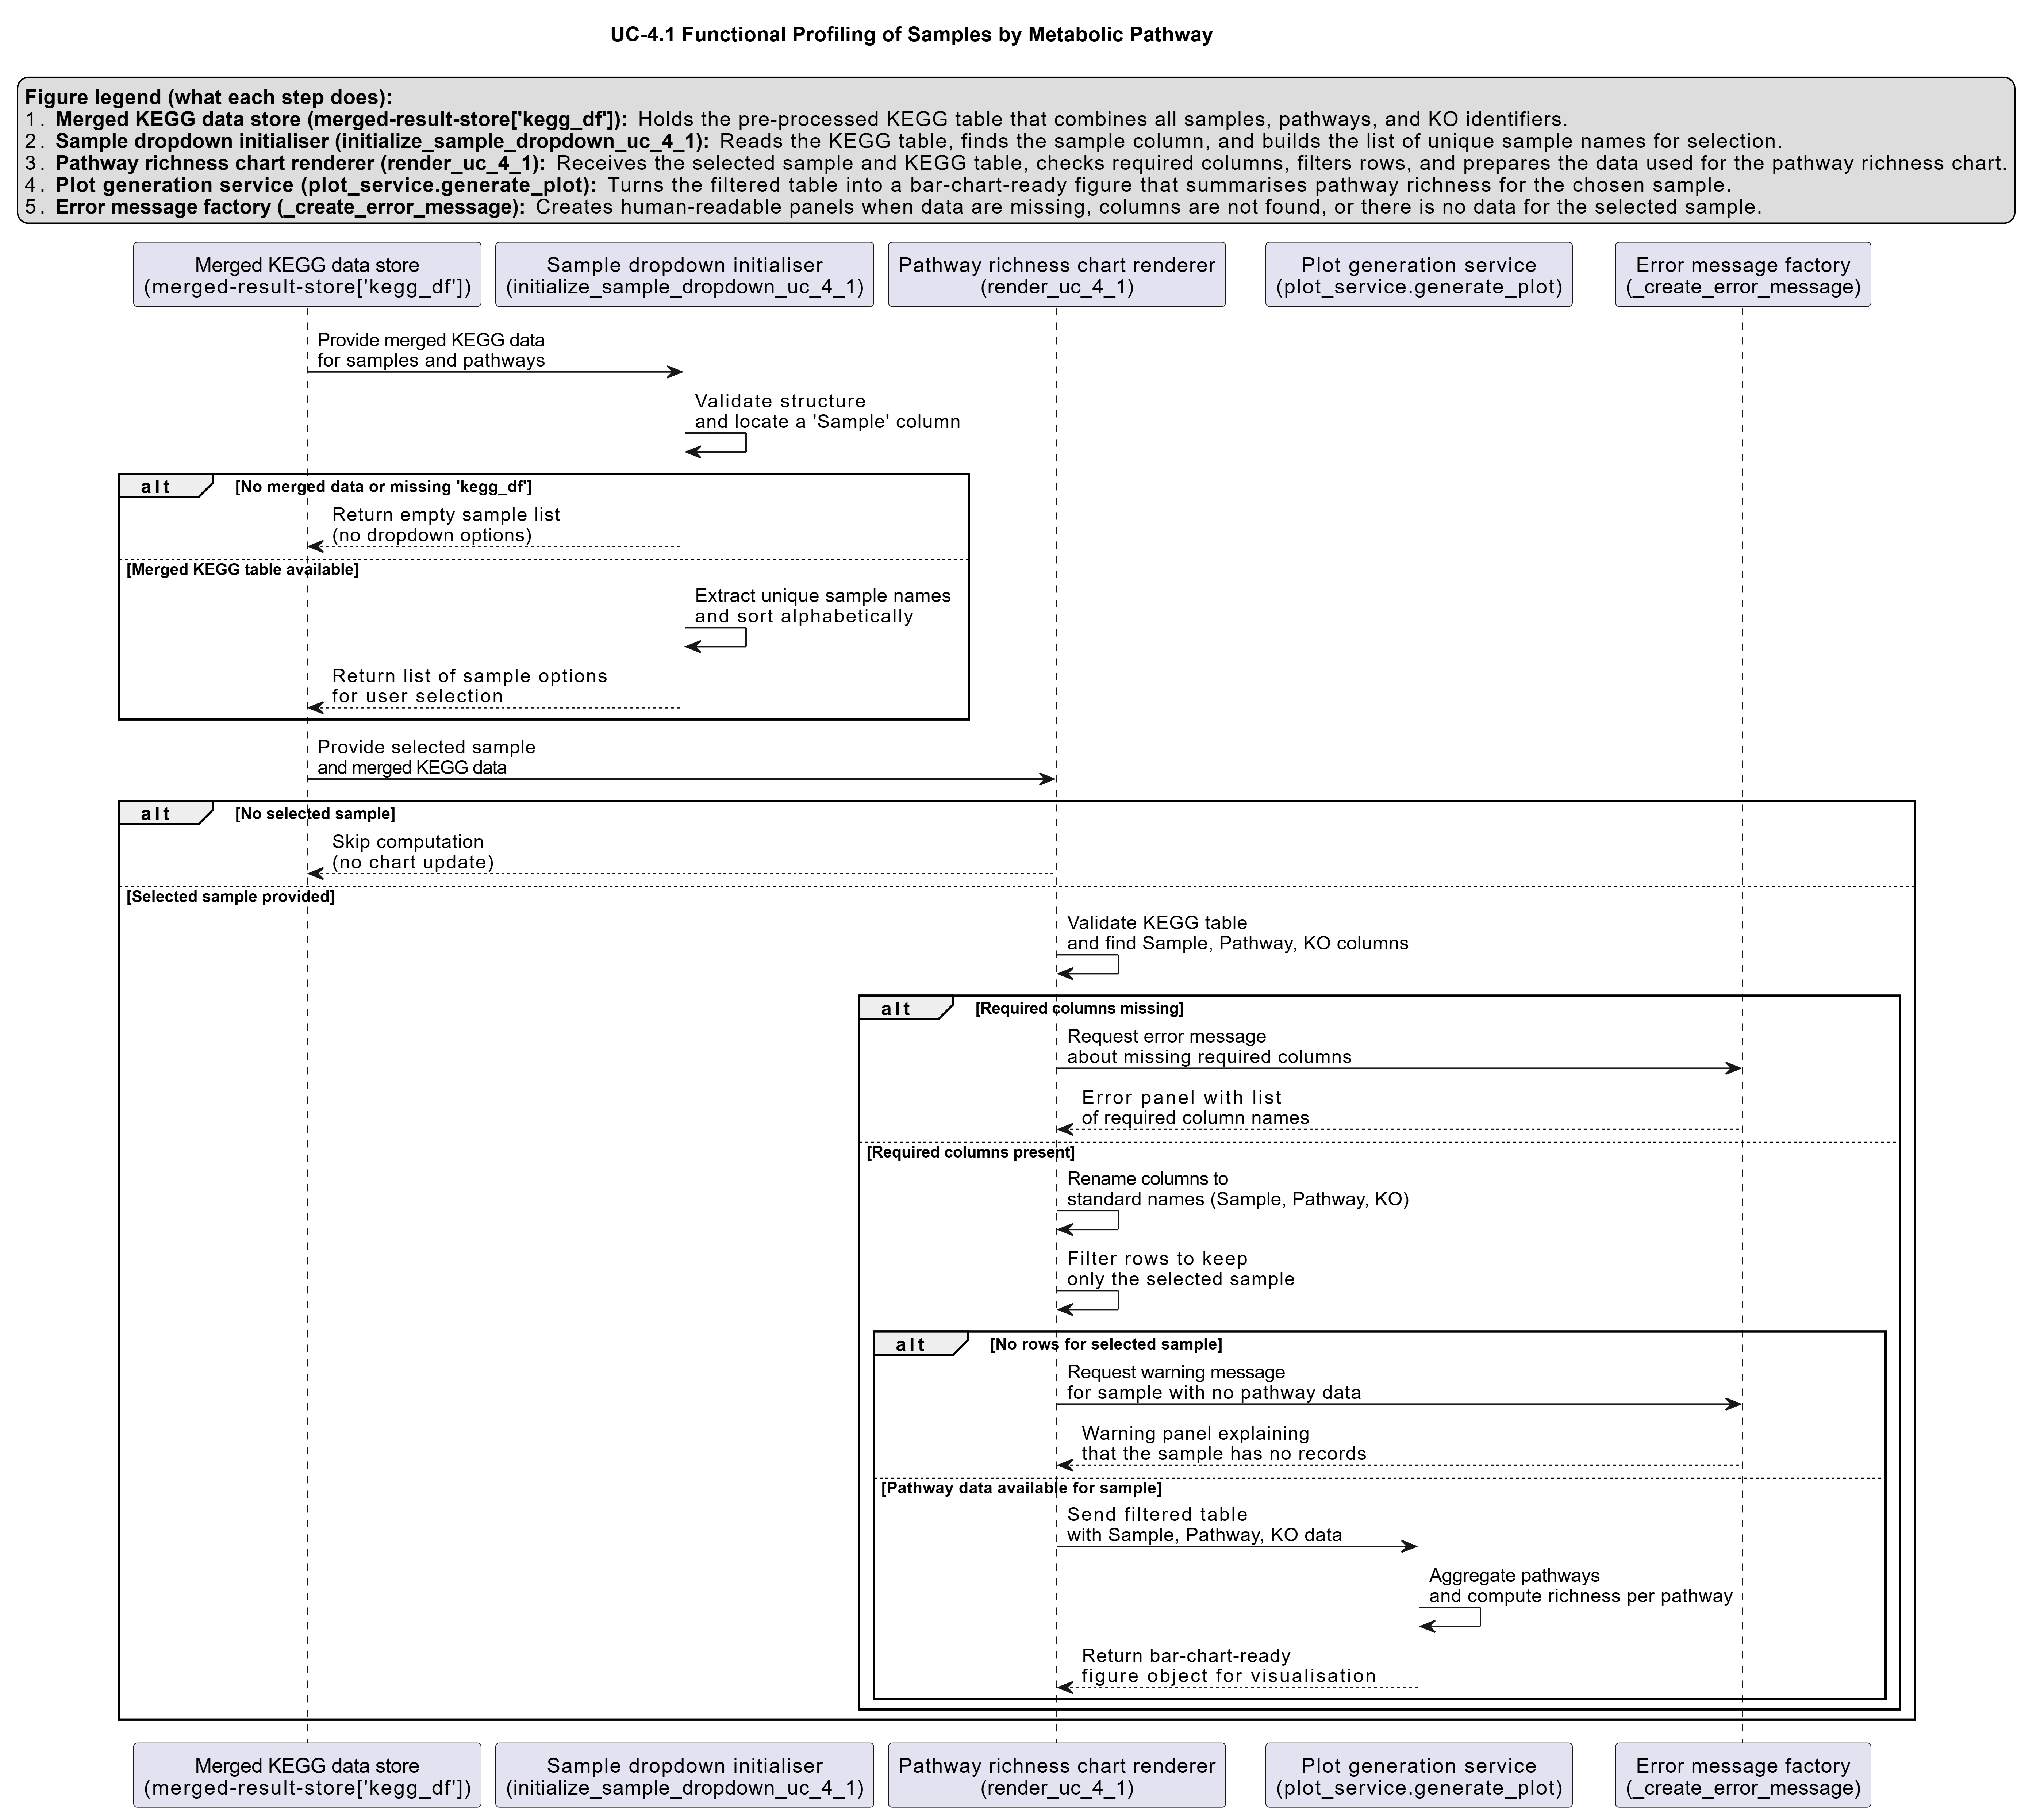
Activity diagram of the use case
Click on the image to enlarge and explore details.