UC-4.11 — Hierarchical View of Genetic Diversity in HADEG Pathways
Module: 4 – Functional and Genetic Profiling
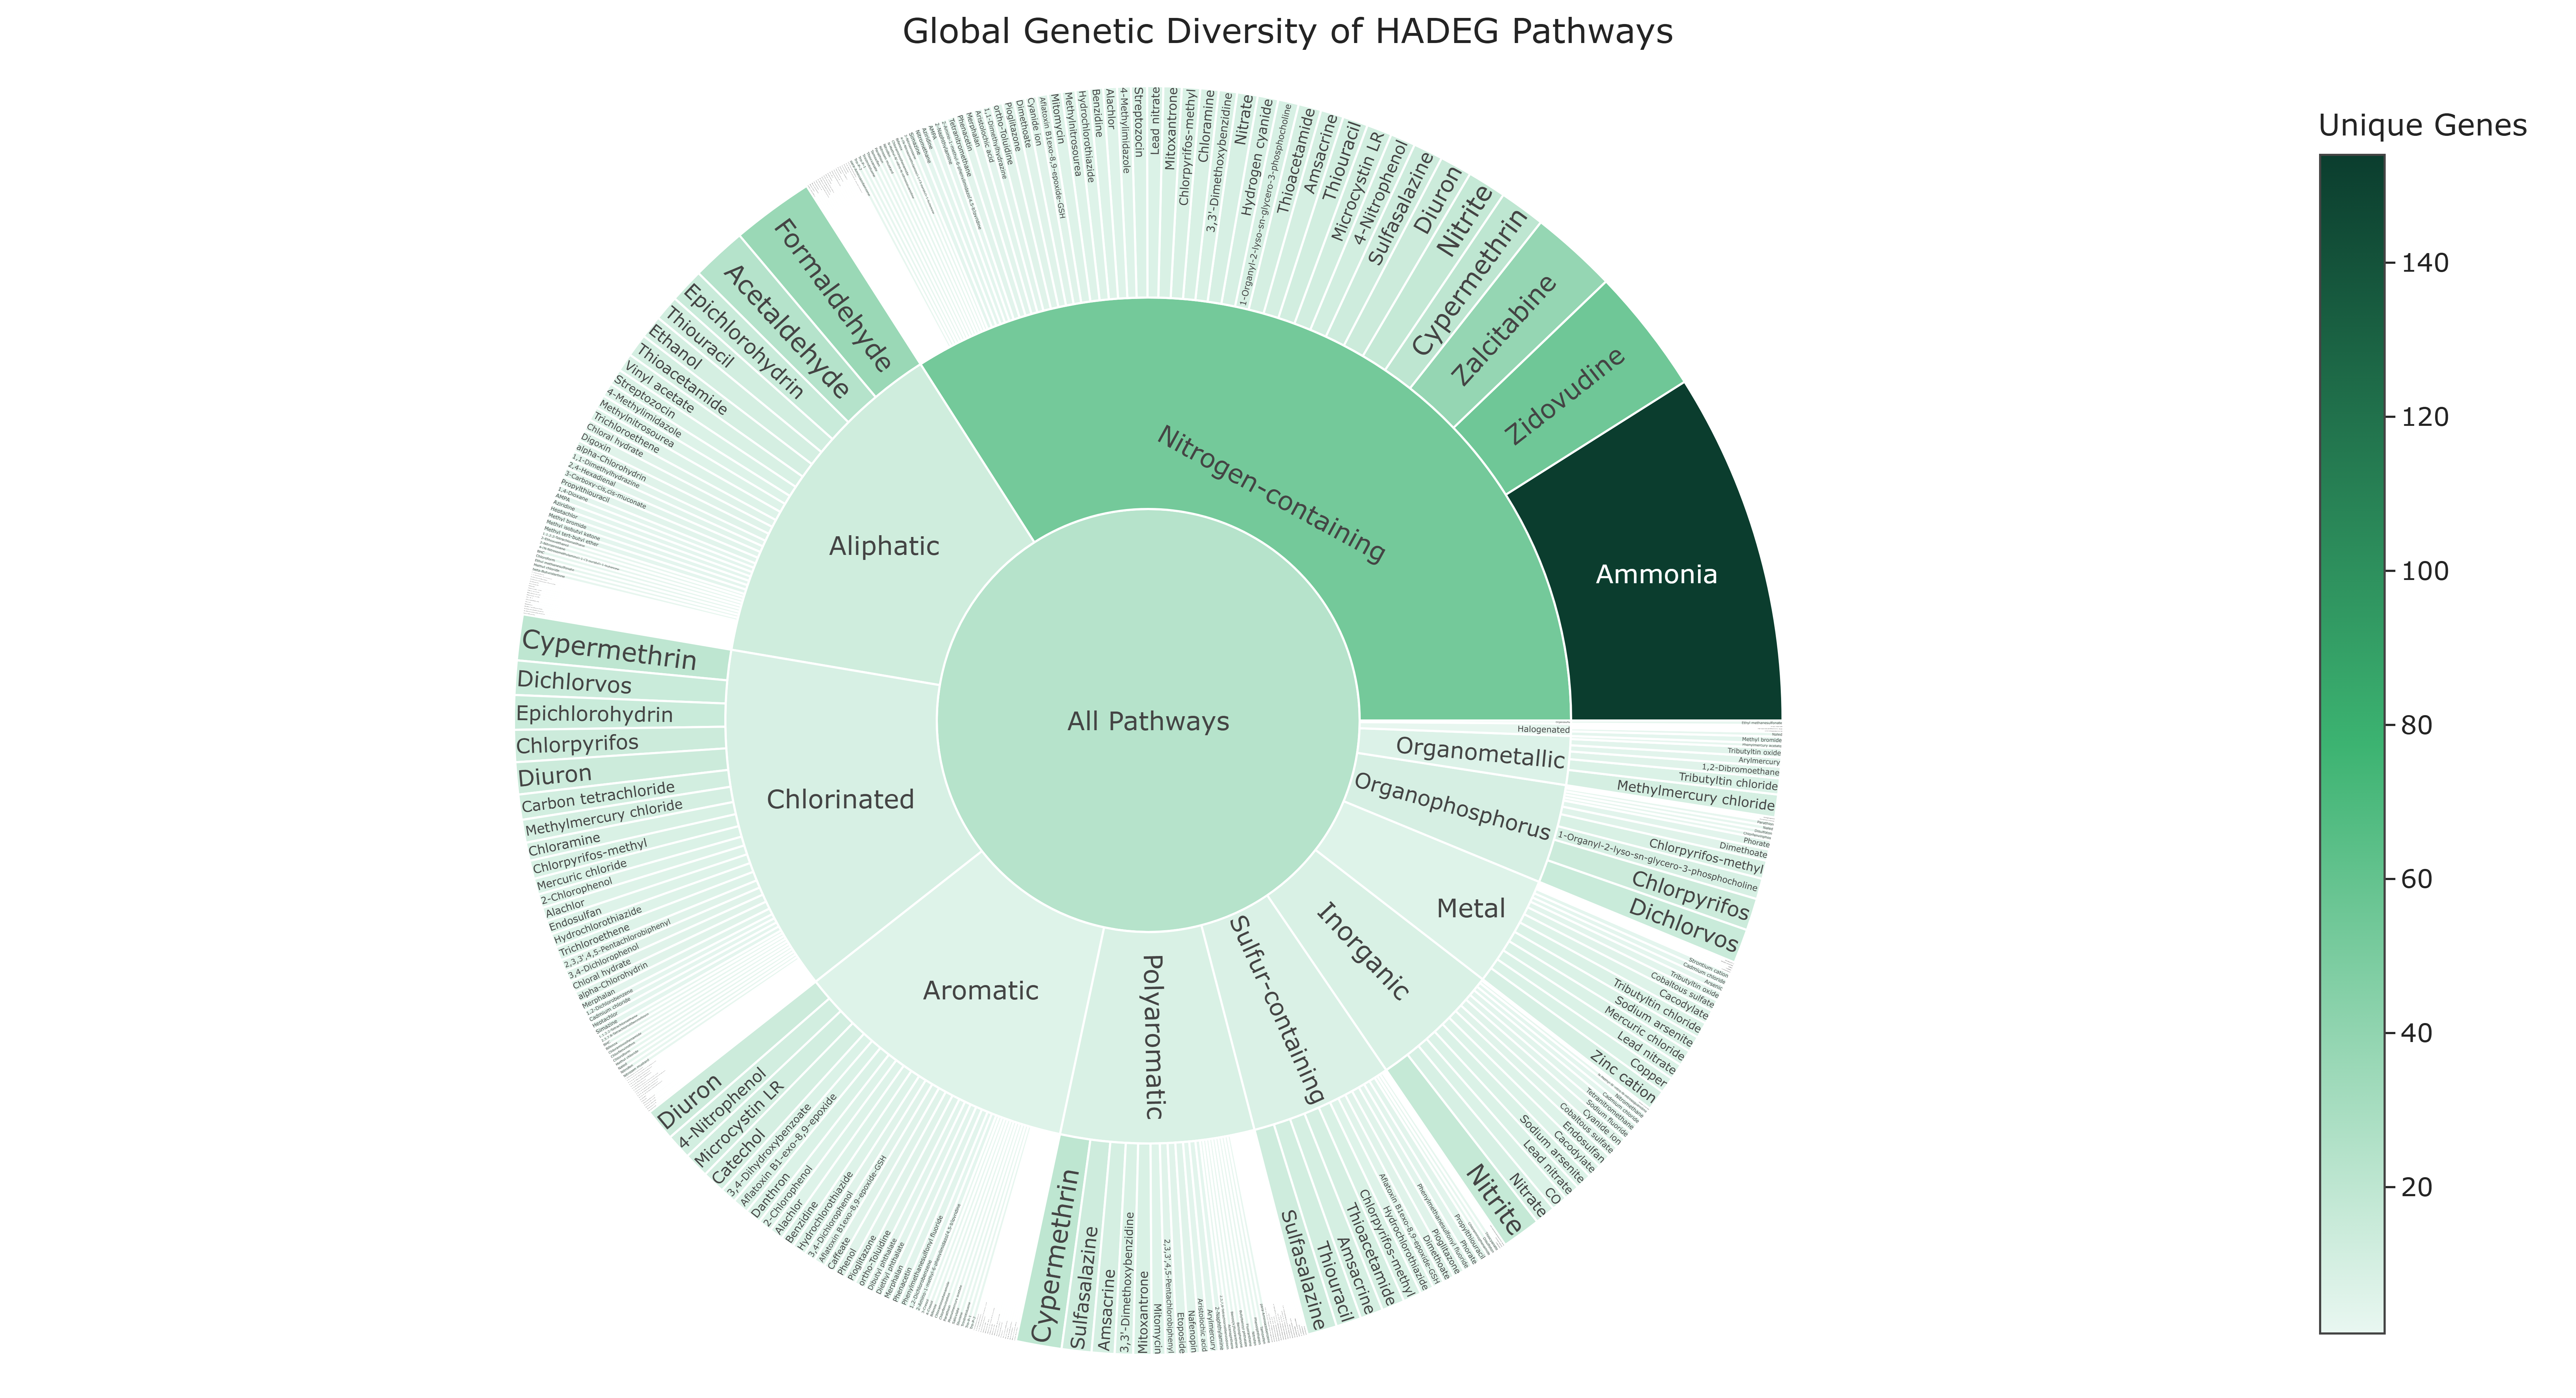
Visualization type: Sunburst chart (hierarchical gene diversity)
Primary inputs: HADEG_Results.xlsx or HADEG_Results.csv (compound_pathway–pathway–gene associations)
Primary outputs: Hierarchical map of genetic diversity across HADEG pathways
Scientific Question and Rationale
Question: What is the overall hierarchical structure of gene annotation diversity within the HADEG dataset, and how is this diversity distributed among compound pathway classes and their specific metabolic routes?
Compound pathway classes (e.g., alkanes, aromatics) are decomposed into more specific metabolic pathways, each associated with multiple annotated genes. Quantifying the number of distinct genes at each level of this hierarchy may reveal:
- which compound classes have the most annotated genes in the HADEG dataset, and
- which specific pathways carry the largest annotated gene repertoires.
Data and Inputs
-
Primary data source:
HADEG_Results.xlsx or HADEG_Results.csv(semicolon-delimited) -
Key columns:
compound_pathway– broad degradation class (e.g., Alkanes, Aromatics)Pathway– specific metabolic pathway within that compound class-
Gene– gene identifier (or symbol) associated with that pathway -
Pre-processing rules:
- Remove rows with missing
compound_pathway,Pathway, orGene -
Optionally standardize identifiers (trim whitespace, harmonize case) to avoid artificial duplicates
-
Output structure (hierarchy):
- Root node: All Pathways
- Inner ring: compound_pathway
- Outer ring: Pathway (children of each compound_pathway)
- Slice size: number of unique genes
Analytical Workflow
- Data Loading
- Import
HADEG_Results.xlsx or HADEG_Results.csvas a semicolon-delimited table. -
Ensure that
compound_pathway,Pathway, andGeneare correctly parsed as categorical/string fields. -
Aggregation of Genetic Diversity
- Group the data by
(compound_pathway, Pathway). - For each pair, compute the number of distinct genes:
unique_gene_count = nunique(Gene)
-
This yields a summary table with:
compound_pathway,Pathway,unique_gene_count.
-
Hierarchy Construction
- Add a synthetic root node (e.g.,
"All Pathways") to serve as the center of the sunburst. - Define the hierarchical path as:
["All Pathways" → compound_pathway → Pathway]
-
Associate
unique_gene_countas the value used to size slices. -
Rendering the Sunburst
- Render a sunburst chart where:
- the center is
"All Pathways", - the first ring corresponds to
compound_pathway, - the second ring corresponds to specific
Pathwayentries, - the slice size and color encode
unique_gene_count.
- the center is
How to Read the Plot
- Concentric Rings (Hierarchy)
- Center:
"All Pathways"– total genetic diversity in the HADEG dataset. - Inner ring: individual compound_pathways.
-
Outer ring: specific Pathways belonging to each compound_pathway.
-
Slice Size (
values) - The angular width of each slice is proportional to its unique gene count.
-
Larger slices = more distinct genes contributing to that class or pathway.
-
Color Encoding
- Slice color also reflects
unique_gene_count, typically with brighter/warmer colors representing higher gene diversity. -
The color scale provides a quick visual cue to locate the most complex regions.
-
Interactivity
- Clicking a slice "zooms in" on that branch:
- focusing on one compound_pathway and its constituent pathways,
- or further isolating a single pathway to see its relative contribution.
Representative Output
The image below illustrates a representative output generated by this use case using the example dataset.
Click on the image to enlarge and explore details.
Interpretation and Key Messages
- Compound Classes with High Annotated Gene Diversity
- In the inner ring, the largest and brightest slices may mark the compound_pathways (e.g., Aromatics, Alkanes) that carry the highest total annotated gene diversity in the HADEG dataset.
-
These classes could represent compound families with broad annotation coverage in the database.
-
Pathways with Large Annotated Gene Repertoires
-
In the outer ring, large slices may reveal specific pathways with many annotated genes, which could reflect:
- complex multi-step processes represented in the annotation database, or
- substantial annotation coverage (many genes annotated for similar roles).
-
Hierarchical Structure of Gene Annotation Diversity
-
The sunburst can support a top-down exploration:
- start at compound classes to identify which broad chemistries have the most annotation coverage,
- then inspect their child pathways to see how gene annotation diversity is partitioned.
-
Prioritization for Deeper Investigation
- Pathways with high annotated gene diversity could be:
- good candidates for deeper annotation review or mechanistic investigation,
- areas where additional sample-level analyses (from other UCs) could be most informative (experimental validation required to confirm functional roles).
Reproducibility and Assumptions
- Input Format Requirements
-
The analysis assumes a semicolon-delimited HADEG results file with at least:
compound_pathway,Pathway,Gene.
-
Counting Rules
- Genetic diversity is defined as the number of unique genes associated with each
(compound_pathway, Pathway)pair. -
Multiple rows for the same gene in the same pathway do not increase the count.
-
Hierarchical Aggregation
- The value for a parent slice (e.g., a compound_pathway) is the sum of the unique gene counts of its child pathways.
-
The root
"All Pathways"represents the sum over all pathways in the input file. -
Scope and Limitations
- The sunburst reflects annotated gene diversity in the HADEG dataset, not pathway expression, flux, or confirmed kinetic capacity.
- Any biases in HADEG curation or gene labeling (e.g., synonyms not merged) will directly influence slice sizes.
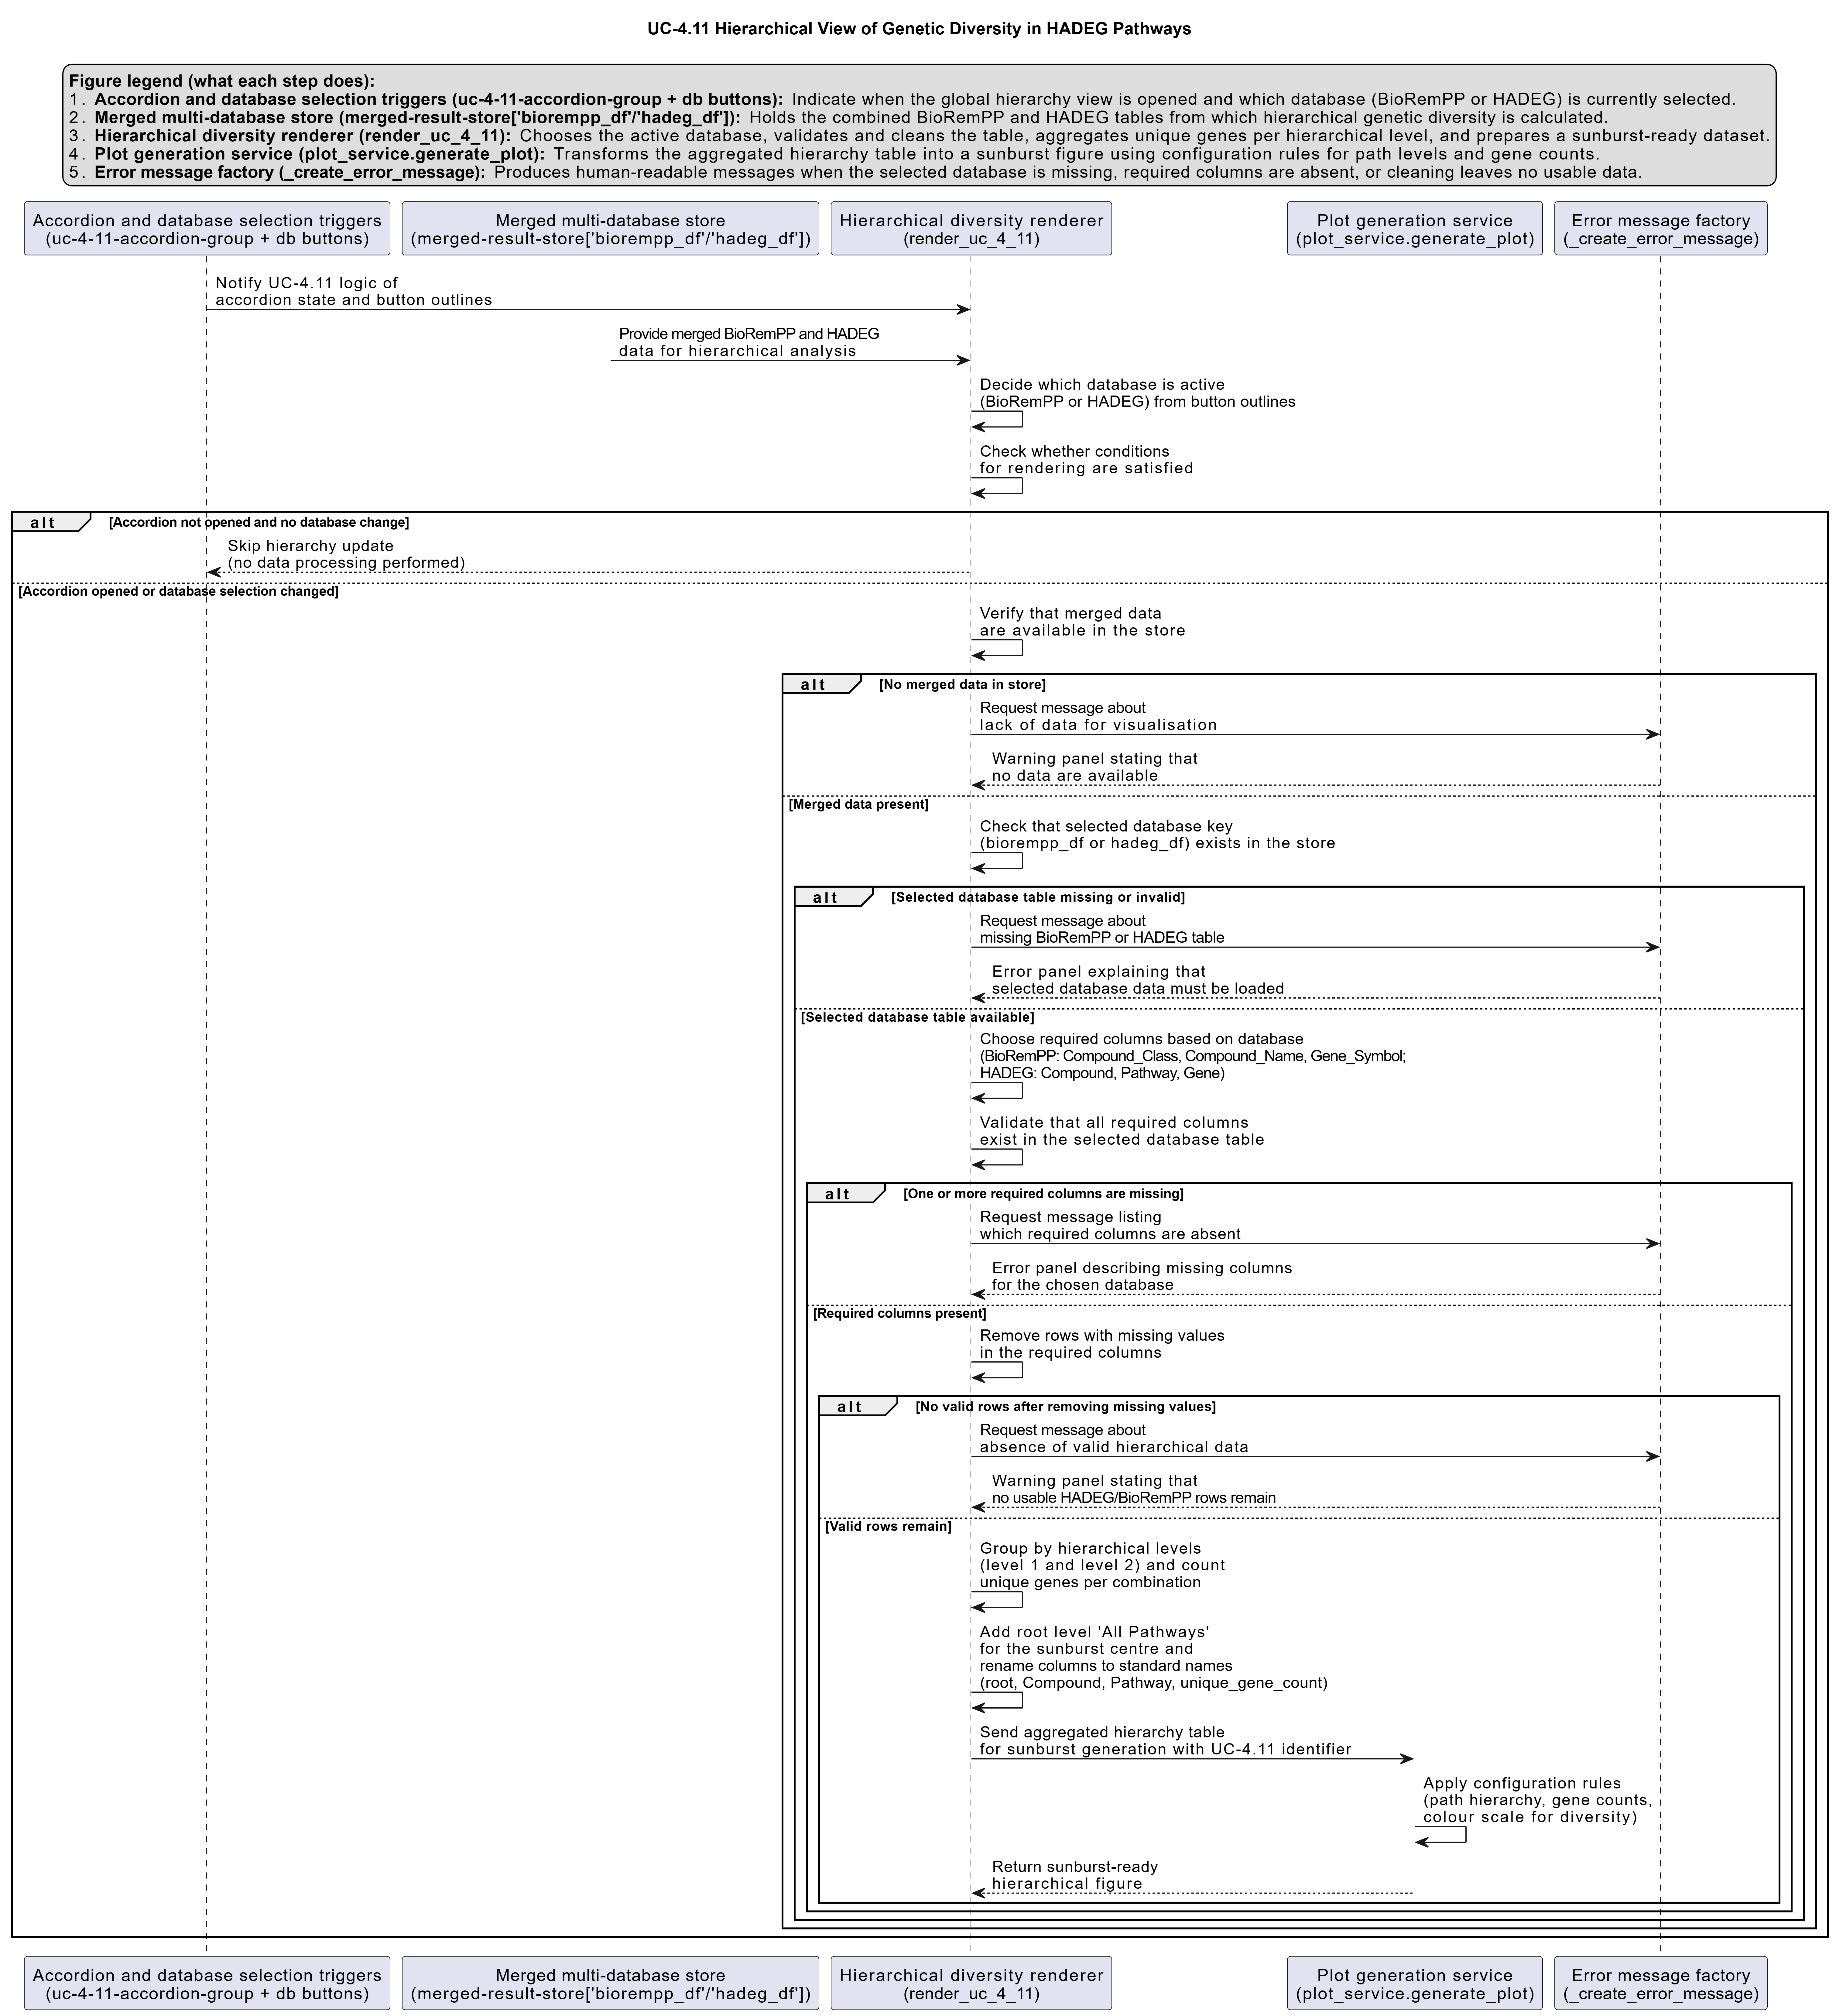
Activity diagram of the use case
Click on the image to enlarge and explore details.