UC-4.12 — Pathway Funcional Map by Sample
Module: 4 – Functional and Genetic Profiling
Visualization type: Heatmap (2D pathway vs. compound class)
Primary inputs: HADEG_Results.xlsx or HADEG_Results.csv (sample–KO–Pathway–compound_pathway)
Primary outputs: Sample-specific matrix of functional richness per Pathway × compound_pathway
Scientific Question and Rationale
Question: For a given sample, how are its specific metabolic pathway KO annotations distributed across the broader chemical families (compound_pathway) with which they are associated?
A single sample can have KO annotations across multiple compound classes (e.g., alkanes, aromatics, chlorinated compounds). Quantifying the unique KO diversity at each intersection of Pathway and compound_pathway may reveal:
- which specific pathways have the most KO annotation coverage within each chemical class, and
- how a sample's KO annotations are distributed across different compound class domains.
Data and Inputs
-
Primary data source:
HADEG_Results.xlsx or HADEG_Results.csv(semicolon-delimited) -
Key columns:
sample– identifier of the analyzed biological sampleko– KEGG Orthology identifier associated with HADEGPathway– specific HADEG/KEGG-like metabolic pathway-
compound_pathway– broader compound class (e.g., Aromatics, Alkanes) -
Pre-processing rules:
- Remove rows with missing
sample,ko,Pathway, orcompound_pathway -
Optionally standardize string fields (trim, harmonize case) to avoid spurious duplicates
-
Output structure:
- 2D matrix for a single selected sample:
- Rows: specific
Pathway - Columns:
compound_pathway - Cell value: count of unique KOs
- Rows: specific
Analytical Workflow
- User Selection
- The user selects a target
samplefrom an interactive dropdown menu. -
All subsequent steps are recomputed dynamically for this selected sample.
-
Dynamic Filtering
- Filter
HADEG_Results.xlsx or HADEG_Results.csvto retain only rows where:sample == selected_sample.
-
Ensure that
Pathway,compound_pathway, andkoare present and valid. -
Aggregation of Functional Richness
- Group the filtered data by
(Pathway, compound_pathway). - For each pair, compute:
unique_ko_count = nunique(ko)
-
This yields a table summarizing the KO diversity for each Pathway within each compound class, for the selected sample.
-
Matrix Construction
-
Pivot the aggregated table into a 2D matrix:
- Rows:
Pathway, - Columns:
compound_pathway, - Values:
unique_ko_count(fill missing combinations with 0).
- Rows:
-
Rendering the Heatmap
- Render the matrix as an interactive heatmap where:
- each cell's color intensity encodes the KO count
- optional annotations can display the numeric values
- tooltips can expose the exact
(Pathway, compound_pathway, KO count)triplet
How to Read the Plot
- Dropdown Menu (Sample Selector)
- Select a Sample to analyze.
-
The heatmap recomputes in real time for the chosen sample.
-
Y-axis (Rows)
-
Each row represents a specific Pathway present in the selected sample.
-
X-axis (Columns)
- Each column corresponds to a broader compound_pathway (compound class).
-
Together, columns define the chemical class "domains" where the sample has KO annotations.
-
Cell Color (Heat Intensity)
- The color of each cell encodes the count of unique KOs at that Pathway × compound_pathway intersection.
- Darker/warmer colors indicate higher functional richness (more distinct KOs).
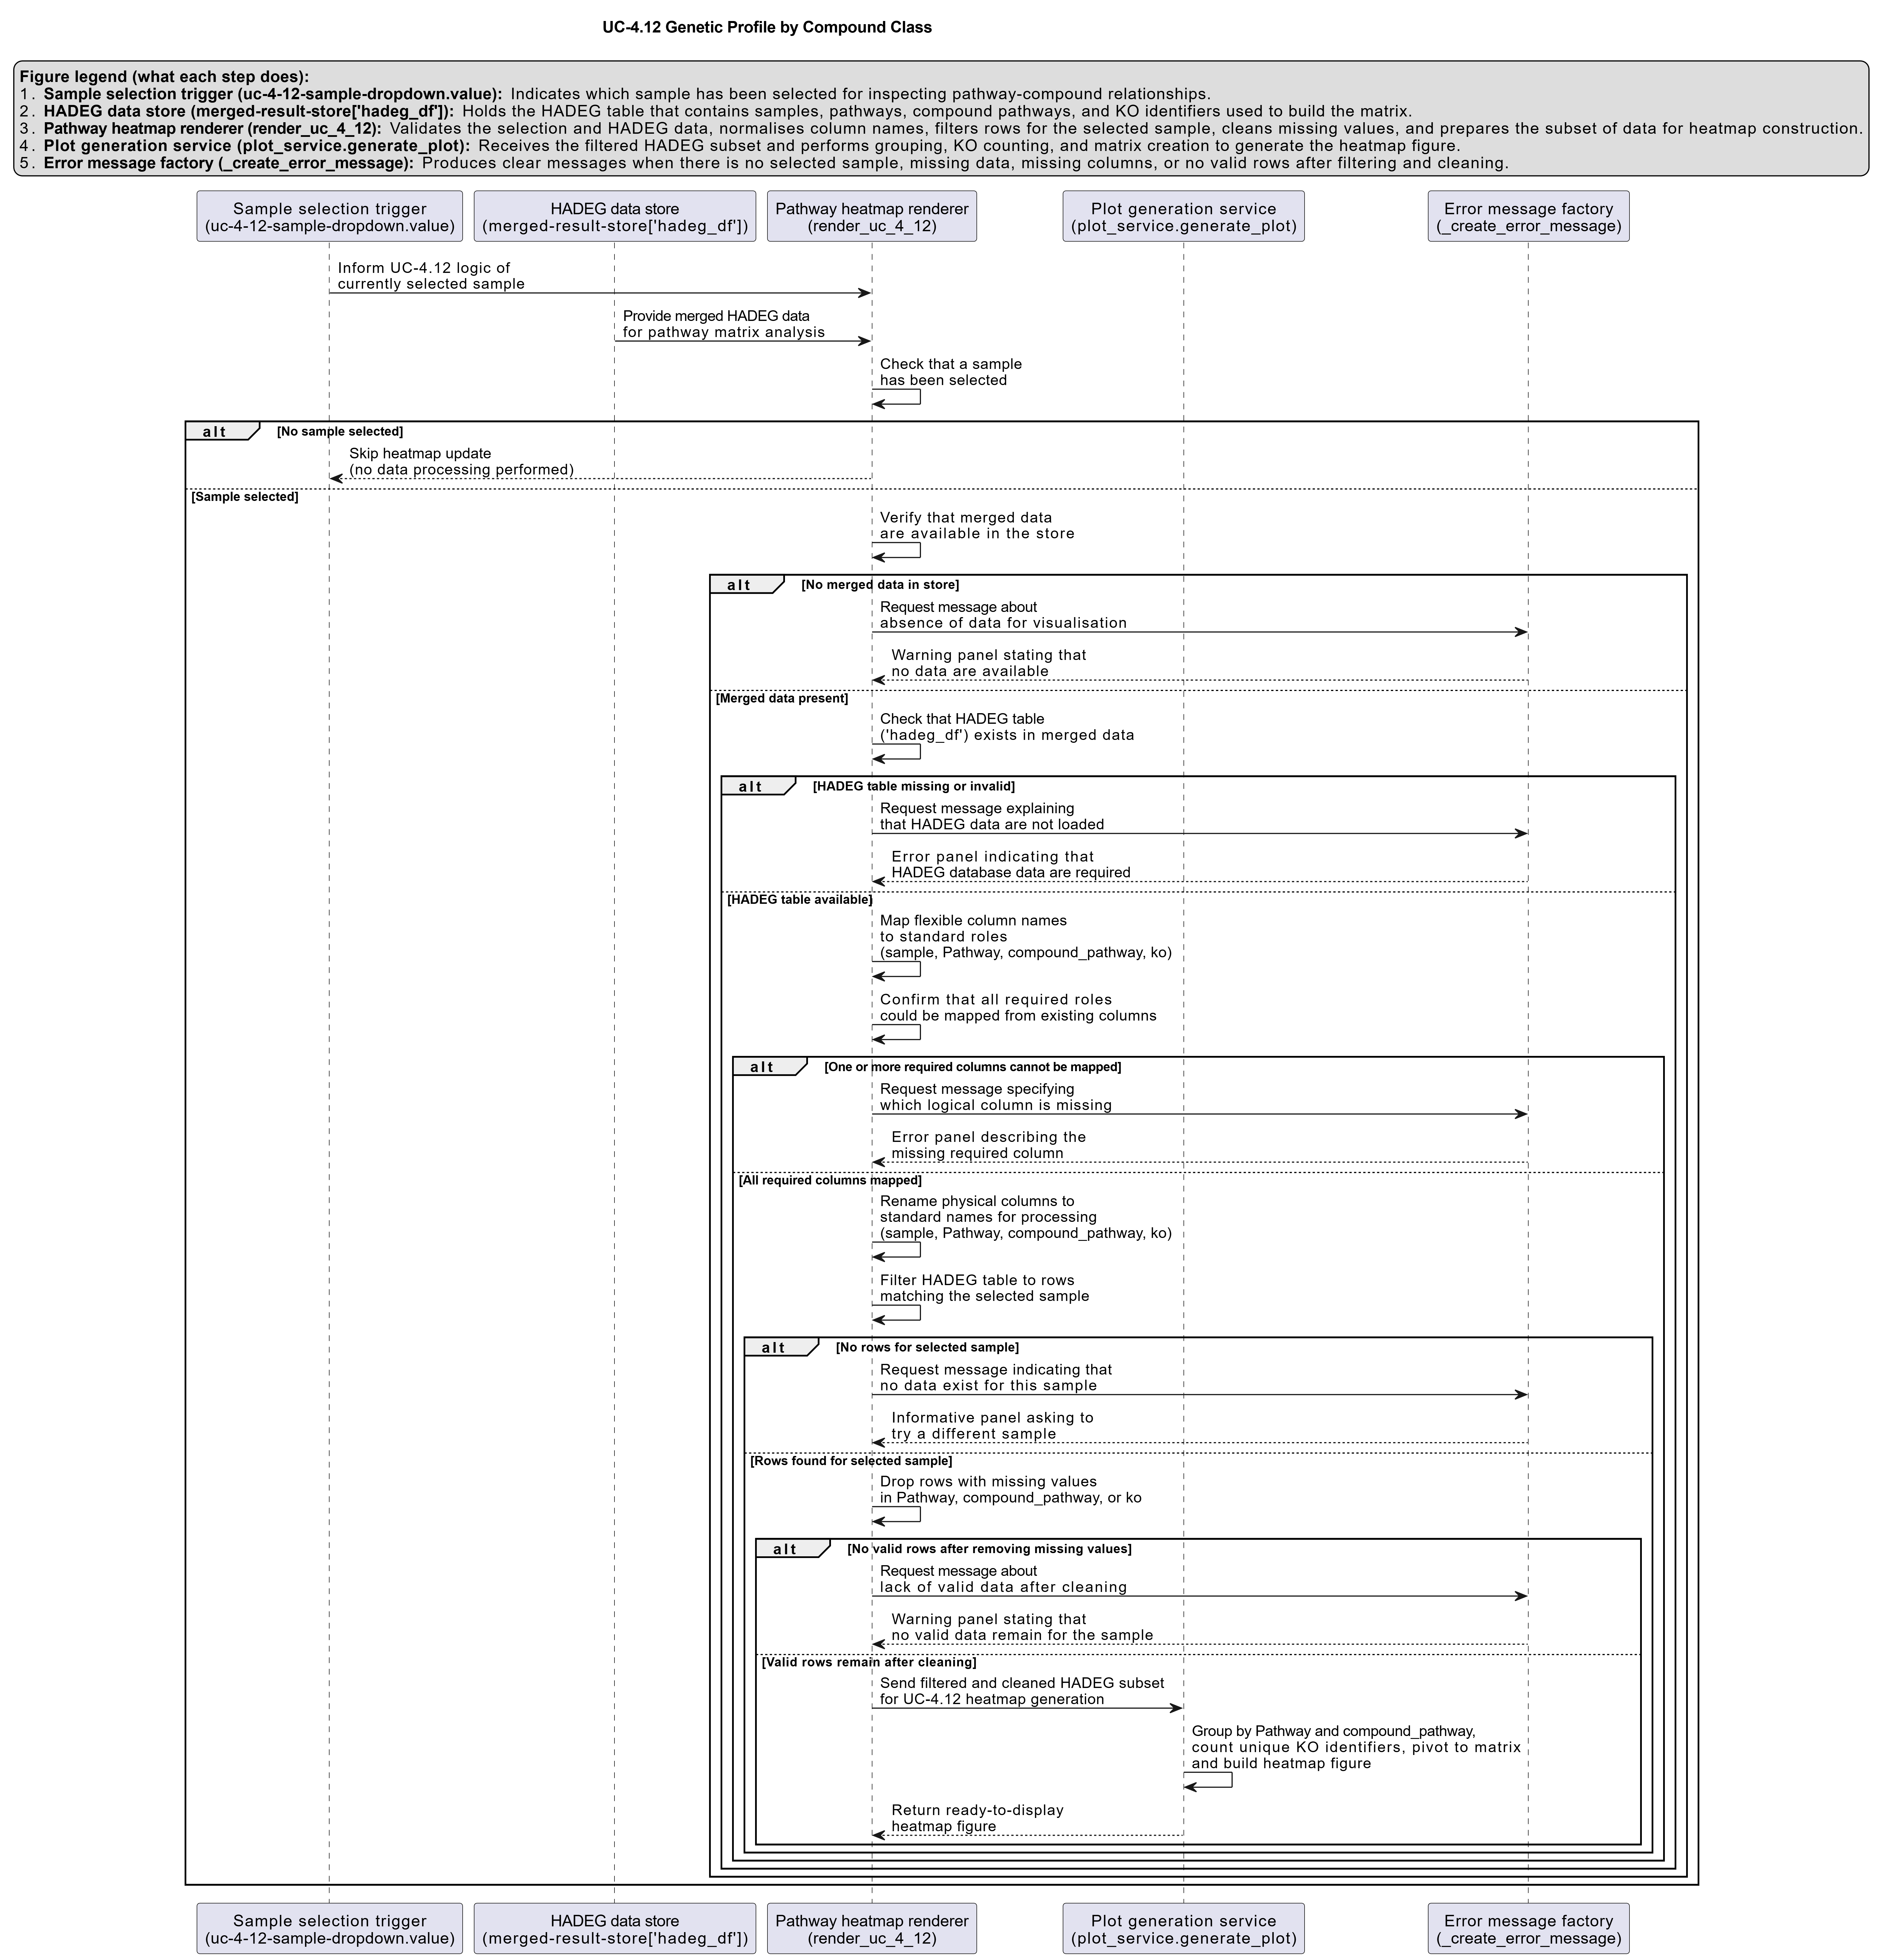
Representative Output
The image below illustrates a representative output generated by this use case using the example dataset.
Click on the image to enlarge and explore details.
Interpretation and Key Messages
- KO Annotation Hotspots
- Cells with intense color ("hotspots") may highlight pathway–compound class intersections with high KO annotation diversity for the selected sample.
-
These may be worth prioritizing for annotation-guided investigation (experimental validation required to confirm functional roles).
-
Sample's KO Annotation Distribution
-
The pattern of hotspots across columns may reveal how a sample's KO annotations are distributed:
- concentration of hotspots in one column (e.g., "Aromatics") may suggest concentrated annotation coverage for that compound class,
- a more balanced spread across many columns could suggest broad KO annotation coverage across multiple compound classes.
-
Pathway-Level KO Annotation Patterns
- Rows with consistently high values across multiple compound classes may indicate pathways with broad KO annotation coverage in the dataset.
-
Conversely, pathways with a single strong cell may be narrowly annotated for one compound class.
-
Comparative Profiling Across Samples
- By switching samples in the dropdown, one can:
- compare which chemical class domains each sample has the most KO annotations for,
- identify samples with complementary annotation patterns, and
- support annotation-guided hypothesis generation for experimental follow-up.
Reproducibility and Assumptions
- Input Format Requirements
-
The analysis assumes a semicolon-delimited HADEG results file containing:
sample,ko,Pathway,compound_pathway.
-
Counting Rules
- Functional richness is defined as the number of unique KOs per
(Pathway, compound_pathway)for the selected sample. -
Multiple rows with the same KO in the same intersection do not increase the count.
-
Scope and Limitations
- The heatmap describes KO annotation presence and diversity, not pathway expression or confirmed activity.
- Differences in annotation depth or KO mapping across pathways or compound classes may influence the observed counts.
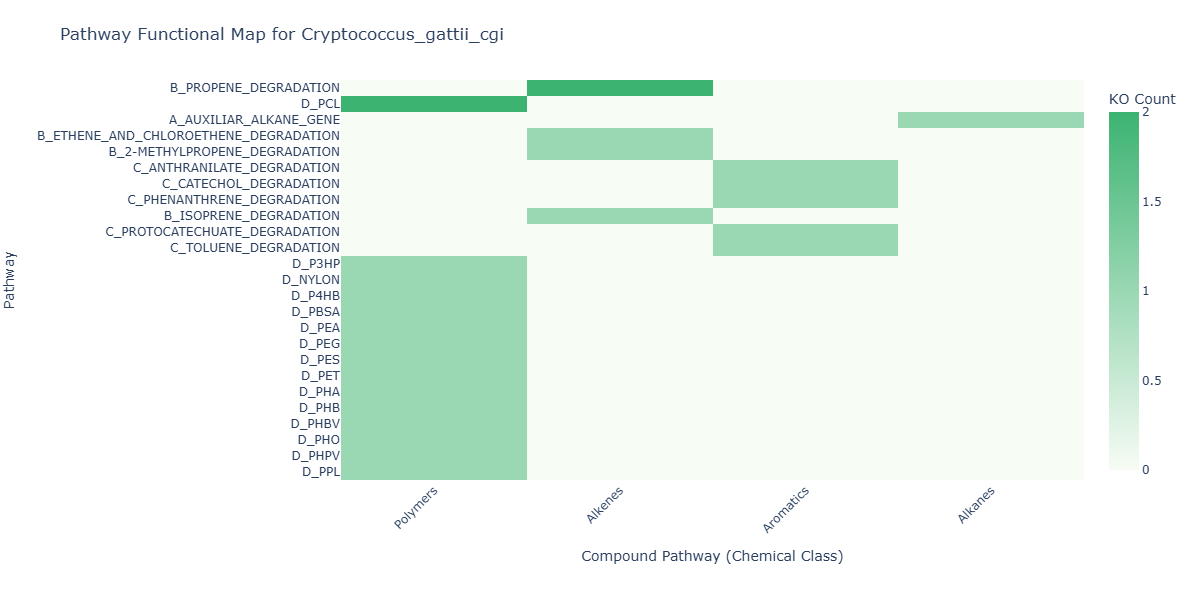
Activity diagram of the use case
Click on the image to enlarge and explore details.