UC-4.13 — Genetic Profile by Compound Class
Module: 4 – Functional and Genetic Profiling
Visualization type: Heatmap (Genes × Samples)
Primary inputs: HADEG_Results.xlsx or HADEG_Results.csv (sample–KO–Gene–compound_pathway)
Primary outputs: Gene-level functional richness matrix per compound pathway
Scientific Question and Rationale
Question: For a given class of degradation pathways (e.g., Alkanes), which genes are annotated in which samples, and how diverse is their KO annotation?
By quantifying, for each gene and sample, how many distinct KOs are associated with that gene in the selected compound class, UC-4.13 may reveal:
- which genes have the broadest KO annotations within that compound class,
- which samples have the most annotated genes for that compound class, and
- how KO annotation diversity is distributed across genes and samples.
Data and Inputs
-
Primary data source:
HADEG_Results.xlsx or HADEG_Results.csv(semicolon-delimited) -
Key columns:
sample– identifier of the analyzed biological sampleGene– gene identifier used in the HADEG mappingko– KEGG Orthology identifier linked to the gene-
compound_pathway– broader degradation pathway / compound class (e.g., Alkanes, Aromatics) -
Pre-processing rules:
- Discard rows with missing
sample,Gene,ko, orcompound_pathway -
Optionally standardize string fields (trim, case normalization) to avoid artificial duplicates
-
Output structure:
- 2D matrix for a selected compound_pathway:
- Rows:
Gene - Columns:
sample - Cell value: count of unique KOs per gene–sample pair
- Rows:
Analytical Workflow
- User Selection
- The user selects a target
compound_pathway(e.g., Alkanes, Aromatics) from an interactive dropdown menu. -
All downstream computations are scoped to this selected compound class.
-
Dynamic Filtering
- Filter
HADEG_Results.xlsx or HADEG_Results.csvto retain only rows where:compound_pathway == selected_compound_pathway.
-
Ensure
sample,Gene, andkoare valid (non-missing, non-placeholder). -
Aggregation and Functional Richness Calculation
- Group the filtered data by
(Gene, sample). - For each pair, compute:
unique_ko_count = nunique(ko)
-
This yields a table summarizing, for the chosen compound_pathway, the KO diversity associated with each gene in each sample.
-
Matrix Construction
-
Pivot the aggregated table into a 2D matrix:
- Rows:
Gene, - Columns:
sample, - Values:
unique_ko_count(fill missing combinations with 0).
- Rows:
-
Rendering the Heatmap
- Render the matrix as an interactive heatmap where:
- each cell's color intensity encodes the KO count for that gene–sample pair
- optional annotations can display the numeric KO counts
- hover tooltips expose
Gene,sample, andunique_ko_count
How to Read the Plot
- Dropdown Menu (Compound Pathway Selector)
- Select the Compound Pathway of interest.
-
The heatmap recomputes for the chosen pathway, showing only the relevant genes and samples.
-
Y-axis (Rows)
- Each row corresponds to a Gene associated with the selected compound_pathway.
-
Rows can be ordered alphabetically or by total KO richness across samples.
-
X-axis (Columns)
- Each column represents a Sample in the dataset.
-
Columns can be ordered by overall KO richness or kept in a fixed order.
-
Cell Color (Heat Intensity)
- The color of each cell indicates the count of unique KOs annotated for that Gene in that Sample within the selected compound_pathway.
- Darker/warmer cells indicate higher functional richness for that gene–sample pair.
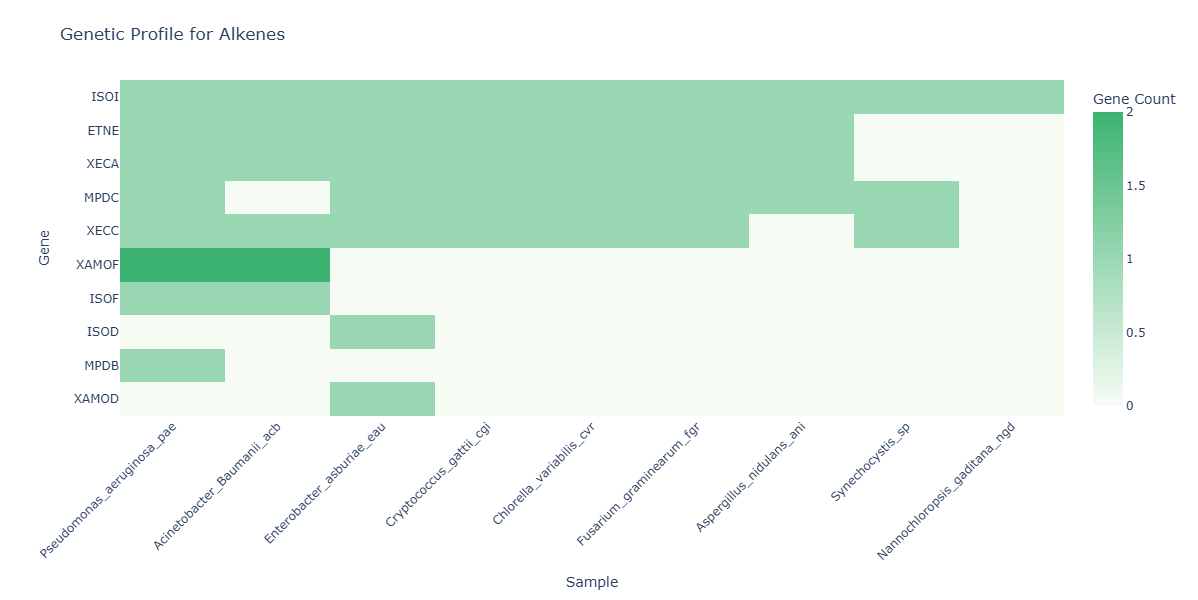
Representative Output
The image below illustrates a representative output generated by this use case using the example dataset.
Click on the image to enlarge and explore details.
Interpretation and Key Messages
- KO Annotation Hotspots
- Brightly colored cells ("hotspots") may identify gene–sample combinations with high KO annotation diversity for the selected compound class.
-
These hotspots could indicate genes with broad KO annotation coverage in a specific sample, worth noting for annotation-guided investigation (experimental validation required to confirm functional roles).
-
Broadly Annotated Genes
-
Rows with consistently high values across many samples may point to genes with broad annotation coverage across the dataset for that compound class.
-
Samples with High Gene Annotation Coverage
- Columns with many bright cells may highlight samples with high annotated gene diversity for the selected compound class.
-
Such samples may be annotation-level candidates for prioritized investigation (experimental validation required).
-
Annotation-level Comparative Analysis
- Comparing patterns of hotspots across samples may reveal:
- whether multiple samples share similar gene annotation patterns (annotation redundancy), or
- whether different samples have different sets of high-diversity gene annotations (annotation complementarity).
- This can support annotation-guided hypothesis generation for further experimental investigation.
Reproducibility and Assumptions
- Input Format Requirements
-
The analysis assumes a semicolon-delimited HADEG results file containing:
sample,ko,Gene,compound_pathway.
-
Counting Rules
- Functional richness is defined as the number of unique KOs per
(Gene, sample)for the selected compound_pathway. -
Multiple rows involving the same
kofor the same(Gene, sample)pair do not increase the count. -
Scope and Limitations
- The heatmap quantifies KO annotation diversity per gene–sample pair, not expression levels or confirmed in situ activity.
- Observed patterns depend on the completeness and curation of the HADEG mapping and KO annotations.
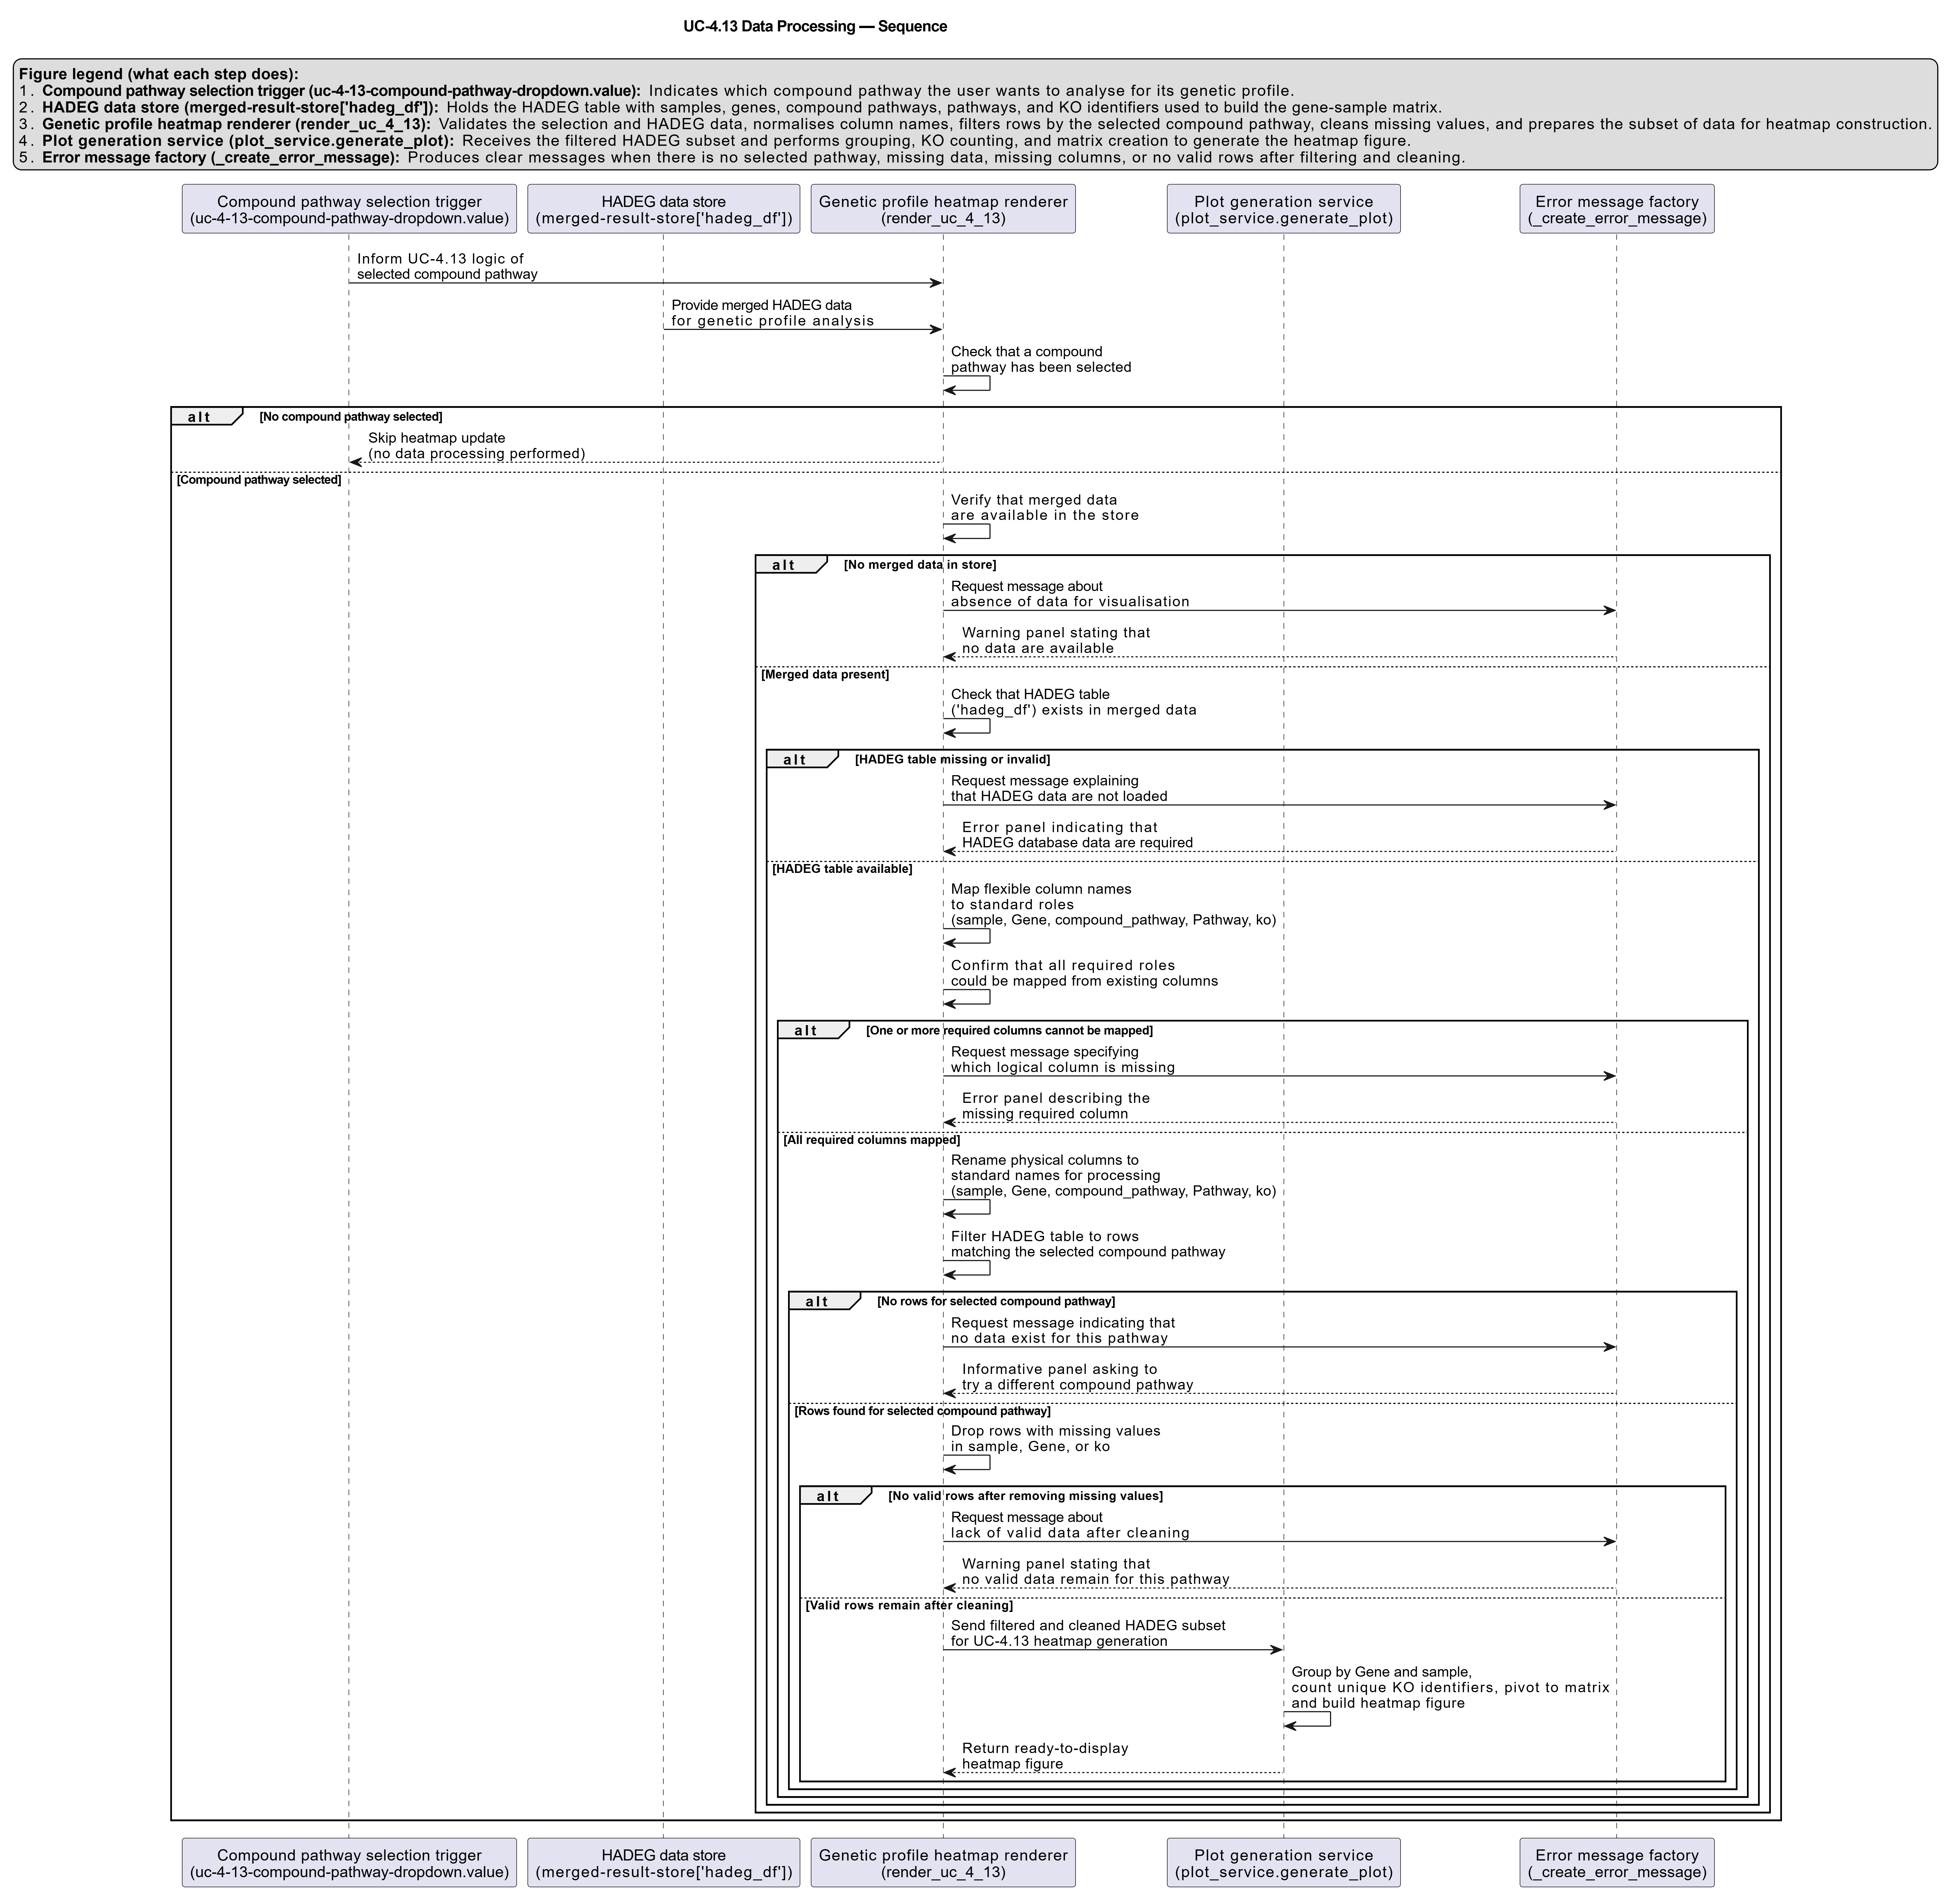
Activity diagram of the use case
Click on the image to enlarge and explore details.