UC-4.2 — Ranking of Samples by Pathway Richness
Module: 4 – Functional and Genetic Profiling
Visualization type: Interactive vertical bar chart (sample-level KO richness for a selected pathway)
Primary inputs: KEGG_Results.xlsx or KEGG_Results.csv (sample–KO–KEGG pathway associations)
Primary outputs: Ranked list of samples by unique KO count for a selected KEGG pathway
Scientific Question and Rationale
Question: For any given metabolic pathway, which samples have the highest KO annotation richness, as measured by their unique KO count?
Instead of asking which pathways dominate a single sample, this analysis inverts the perspective: for a selected KEGG pathway, it compares all samples in terms of how many distinct KEGG Orthology (KO) identifiers are annotated for that pathway in each sample.
The result is a pathway-centric ranking of samples by KO annotation richness that:
- may identify samples with the most extensive KO annotations for specific pathways, and
- can help compare samples along a continuum from broad KO representation across many pathways to narrower representation.
This may be useful for annotation-based sample comparison and hypothesis generation (experimental validation required to confirm functional roles).
Data and Inputs
- Primary data source:
KEGG_Results.xlsx or KEGG_Results.csv(semicolon-delimited) - Key columns:
sample– identifier for each biological samplepathname– KEGG pathway name or identifier-
ko– KEGG Orthology (KO) identifier associated with that sample and pathway -
User control:
-
A dropdown menu allowing selection of a single metabolic pathway (
pathname) to analyze. -
Output structure:
- Bars: samples associated with the selected pathway
- Bar value: pathway-level KO richness per sample (count of unique KOs for that
sample–pathnamepair)
Analytical Workflow
- Pathway Selection (User Input)
The user selects a metabolic pathway from an interactive dropdown menu. -
Internally, this corresponds to choosing one
pathnamevalue. -
Dynamic Filtering
- The KEGG results table
KEGG_Results.xlsx or KEGG_Results.csvis loaded. -
The dataset is filtered to retain only rows where:
pathnameequals the selected pathway, andsampleandkoare valid and non-missing.
-
Aggregation of KO Richness per Sample
- The filtered data is grouped by
sample. - For each sample, the number of distinct KO identifiers is computed (e.g., via
nunique()onko). -
This count represents the pathway-specific KO richness of that sample.
-
Sorting and Rendering
- The resulting
(sample, unique_ko_count)pairs are sorted in descending order of KO count. - The aggregated data is rendered as a vertical bar chart, where:
- the x-axis lists samples, and
- the y-axis encodes the unique KO count.
Optionally, numeric labels can be added on top of each bar to show the exact KO count.
How to Read the Plot
- Dropdown Menu (Pathway Selection)
- Use the menu to select the Metabolic Pathway (
pathname) of interest. -
The bar chart recomputes and updates automatically for the selected pathway.
-
X-axis (Samples)
- Each tick on the x-axis corresponds to an individual Sample that has at least one KO annotated for the selected pathway.
-
The set of samples displayed represents all entities contributing at least partially to that pathway.
-
Y-axis (KO Richness)
- The y-axis represents the count of unique KOs associated with the selected pathway for each sample.
-
Higher values reflect more extensive KO annotation coverage for that pathway in that sample.
-
Bars (Height and Optional Labels)
- The height of each bar is proportional to the number of unique KOs that sample contributes to the selected pathway.
- Optional labels on each bar can display the exact KO count, making it easier to compare samples quantitatively.
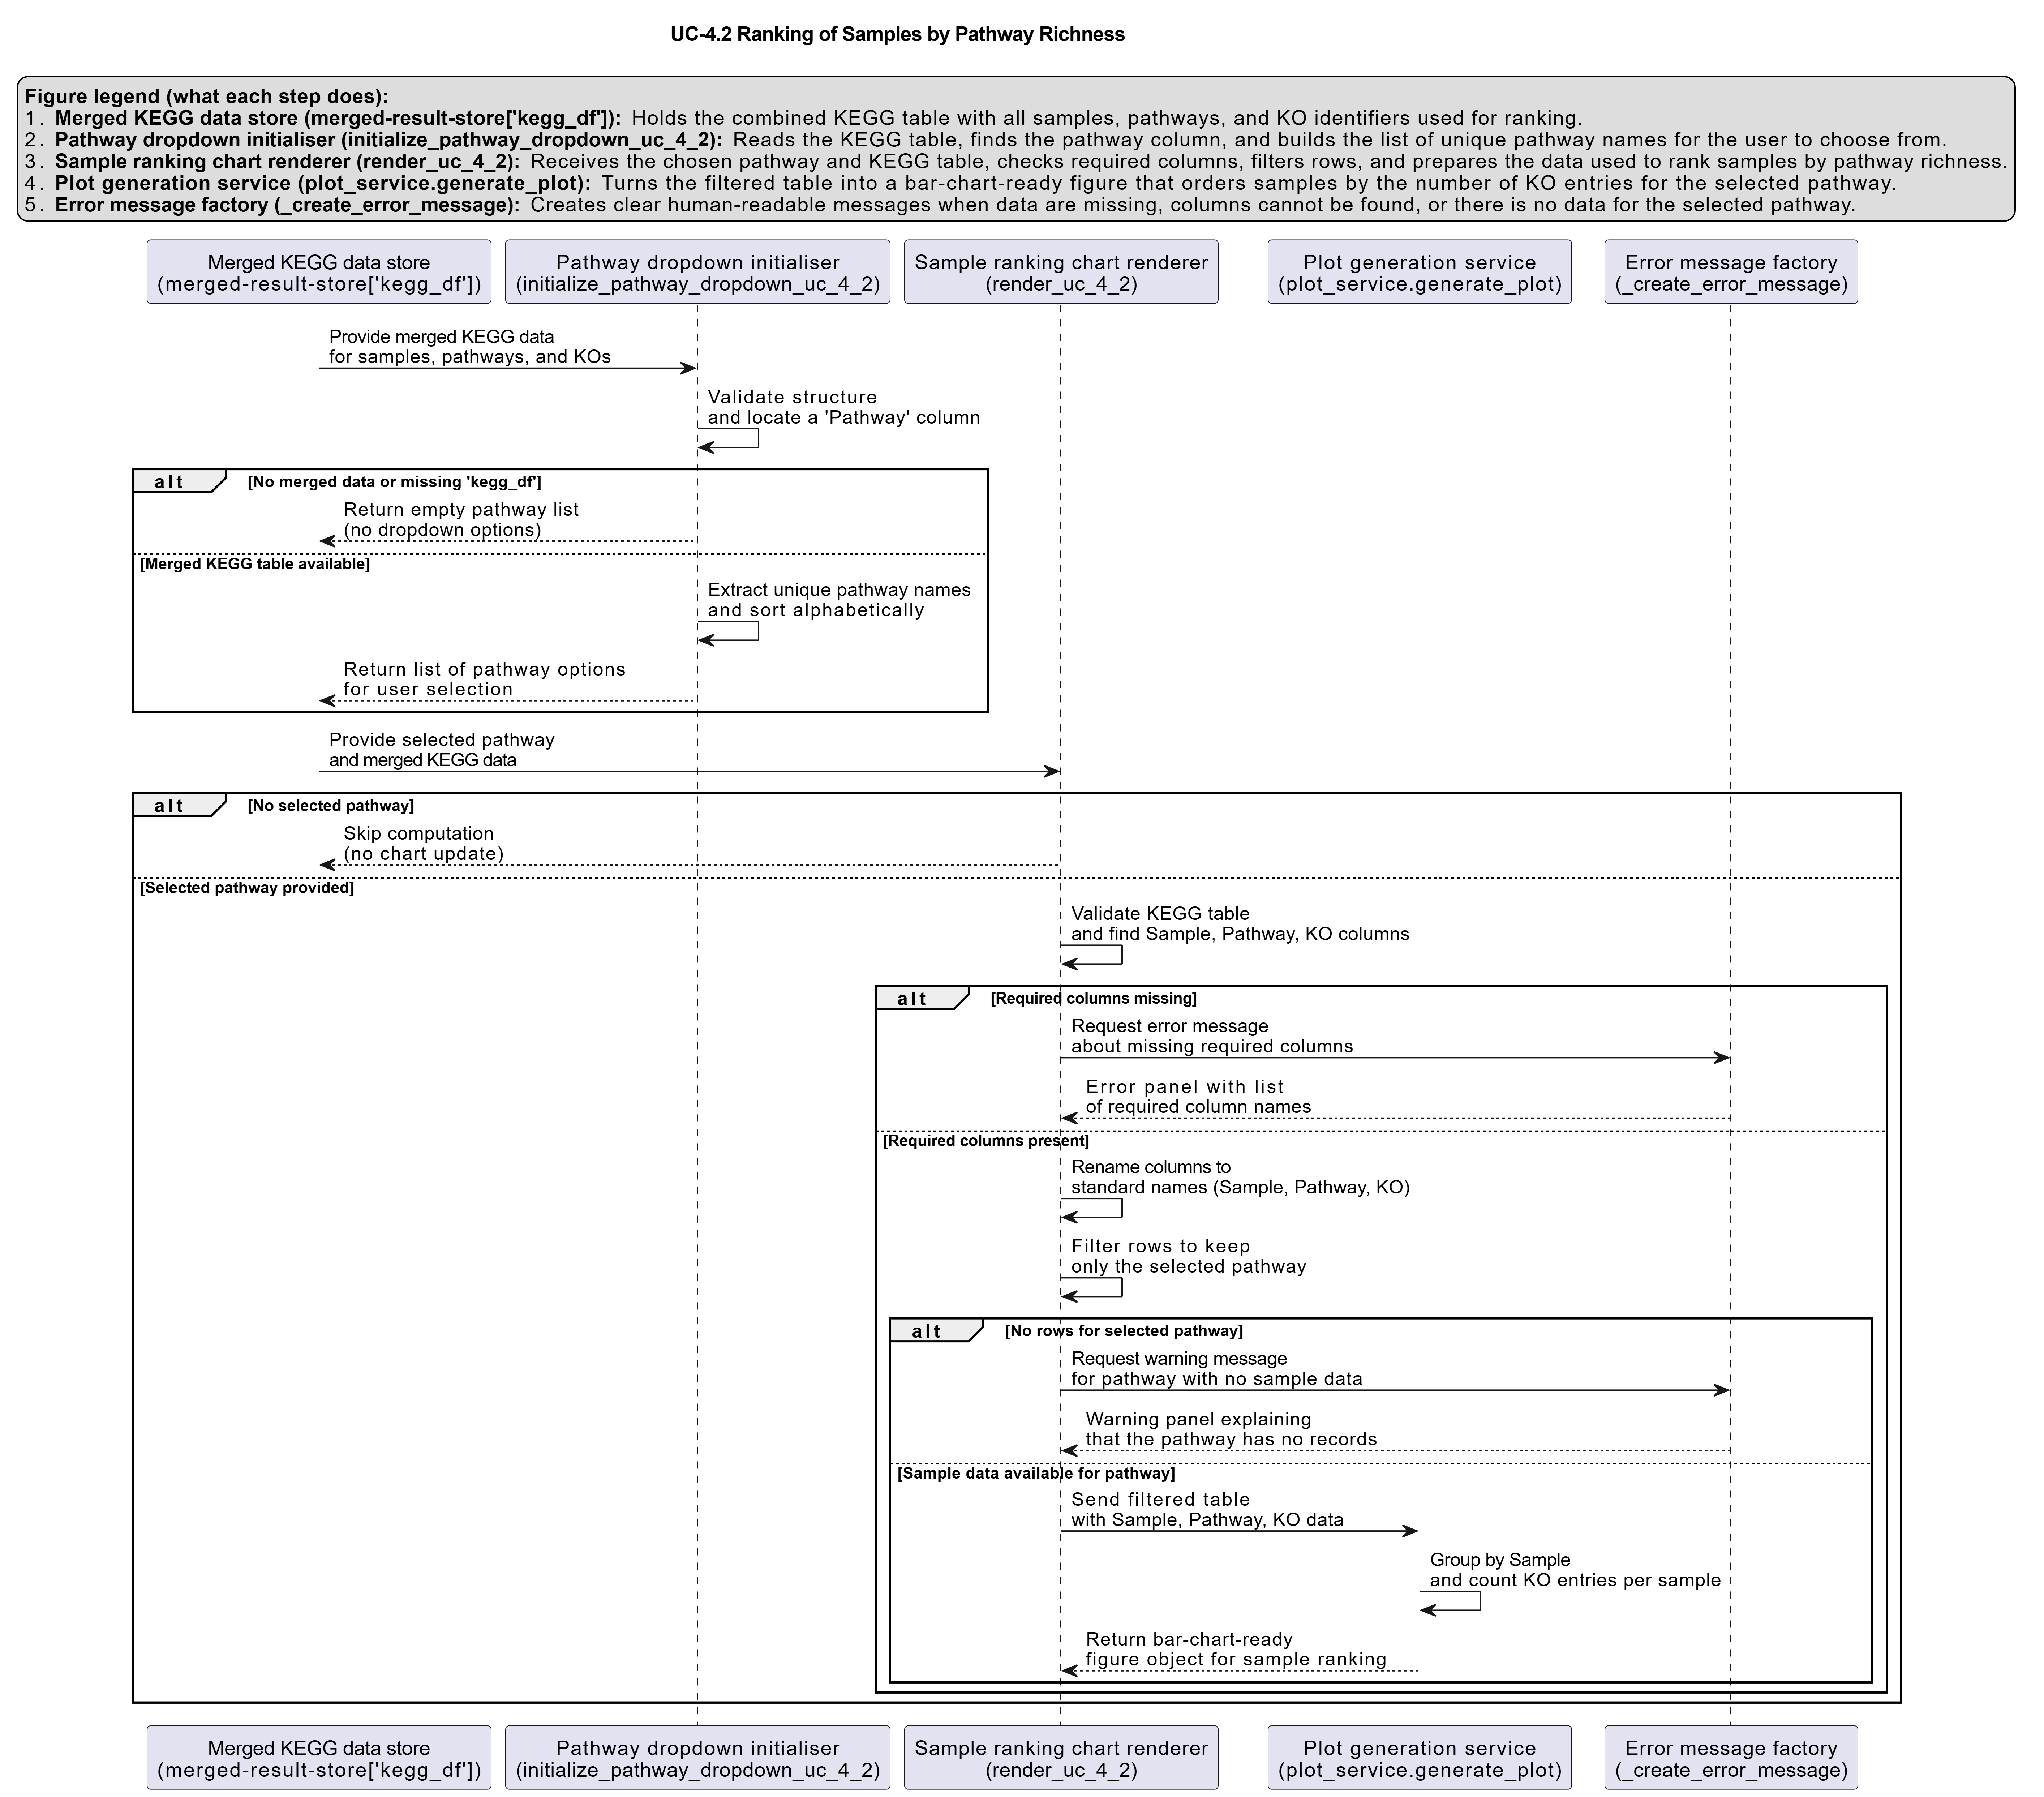
Representative Output
The image below illustrates a representative output generated by this use case using the example dataset.
Click on the image to enlarge and explore details.
Interpretation and Key Messages
- Pathway KO Annotation Richness
- Taller bars may indicate samples with higher pathway-specific KO annotation richness.
-
These samples could be annotation-level candidates for prioritized experimental investigation for that pathway (as complemented by UC-8.x completeness scorecards).
-
Comparing Samples by Pathway KO Annotation
- For a pathway of interest, the top-ranked samples in this chart have the most extensive KO annotations for that pathway in the dataset.
-
Such samples may be worth considering as starting points for annotation-guided experimental investigation (experimental validation required to confirm functional roles).
-
How the Ranking Shifts Across Pathways
-
By cycling through different
pathnamevalues in the dropdown, users can see how the ranking of samples changes from one pathway to another:- A sample that ranks highly for many pathways has broad KO annotation coverage across the KEGG space,
- whereas a sample that ranks highly for only one or two pathways has more concentrated KO annotation coverage.
-
Link to Other Analyses
- This visualization can complement pathway completeness matrices (e.g., UC-8.5) and KO-based UpSet analyses by providing a straightforward per-pathway ranking of samples by KO annotation richness.
- It may be useful for orienting further annotation-level exploration before proceeding to more detailed analyses.
Reproducibility and Assumptions
- Input Format
The analysis requires a semicolon-delimited KEGG results table containing at least: sample,pathname,-
ko. -
Definition of Richness
- Pathway "richness" for a sample is defined as the count of unique KO identifiers mapped to the selected pathway for that sample.
-
Duplicate
(sample, pathname, ko)entries in the raw data are collapsed so that each KO is counted once per sample per pathway. -
Scope of Inference
- The metric captures KO annotation presence, not expression, regulation, or flux.
-
A high KO count suggests rich annotation coverage, but does not alone confirm pathway function or activity under any specific environmental conditions.
-
Comparability Across Pathways
- KO counts are not normalized by the total possible KOs in each pathway in this use case; they should therefore be interpreted within a pathway (comparing samples to each other) rather than directly across very different pathways.
- For normalized comparisons across pathways, the pathway completeness scorecards (e.g., UC-8.5) provide a complementary view.
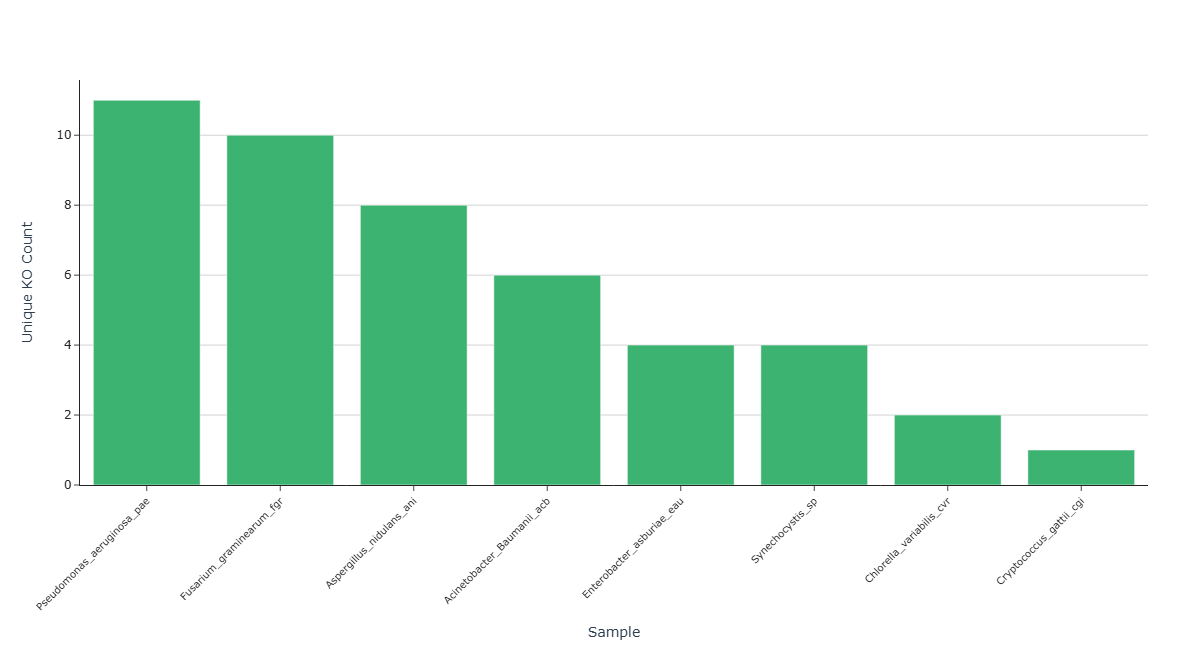
Activity diagram of the use case
Click on the image to enlarge and explore details.