UC-4.4 - Functional Fingerprint of Samples by Pathway
Module: 4 – Functional and Genetic Profiling
Visualization type: Interactive radar (polar) plot (pathway-level KO richness for a selected sample)
Primary inputs: KEGG_Results.xlsx or KEGG_Results.csv (sample–KO–KEGG pathway associations)
Primary outputs: Pathway-level "functional fingerprint" of a selected sample
Scientific Question and Rationale
Question: What is the KO annotation fingerprint of each sample, as defined by the distribution of unique KO annotations across its metabolic pathways?
Rather than comparing samples for a single pathway, this use case focuses on characterizing one sample across all its KEGG pathways.
By summarizing, for a selected sample, the unique KO richness per pathway and representing it on a radar (polar) plot, the visualization can provide an intuitive, shape-based KO annotation fingerprint. This may reveal:
- which pathways have particularly high or concentrated KO annotation coverage for that sample, and
- whether the sample has annotations distributed broadly across many pathways or concentrated in a narrower set.
Data and Inputs
- Primary data source:
KEGG_Results.xlsx or KEGG_Results.csv(semicolon-delimited) - Key columns:
sample– identifier for each biological samplepathname– KEGG pathway name or identifier-
ko– KEGG Orthology (KO) identifier associated with that sample and pathway -
User control:
-
A dropdown menu allowing selection of a single Sample (
sample) for detailed profiling. -
Output structure:
- Axes (θ): one axis per KEGG pathway (
pathname) present in the selected sample - Radius ®: unique KO count for each
(sample, pathway)pair - Polygon: a closed shape connecting all pathway points, representing the sample's functional fingerprint
Analytical Workflow
- Sample Selection (User Input)
The user selects a single sample from an interactive dropdown menu. -
All subsequent filtering and aggregation are restricted to this selected
sample. -
Dynamic Filtering
- The KEGG results table
KEGG_Results.xlsx or KEGG_Results.csvis loaded. -
The dataset is filtered to retain only rows where:
sampleequals the selected sample, and- both
pathnameandkoare valid and non-missing.
-
Aggregation of Pathway-Level KO Richness
- The filtered data is grouped by
pathname. - For each pathway, the number of distinct KO identifiers is computed (e.g., via
nunique()onko). -
This produces a set of
(pathname, unique_ko_count)pairs representing the pathway-level KO richness for that sample. -
Rendering as Radar (Polar) Plot
- Each
pathnameis mapped to an angular coordinate (θ) around the circle. - The corresponding radius ® is the unique KO count for that pathway.
- A closed polygon is drawn by connecting these points, optionally with markers at each vertex:
- axes: metabolic pathways
- radius: KO richness for the selected sample in each pathway
How to Read the Plot
- Dropdown Menu (Sample Selection)
- Use the menu to select the Sample whose functional fingerprint you want to inspect.
-
The radar plot recomputes and updates automatically.
-
Axes (θ – Metabolic Pathways)
- Each radial axis represents a KEGG Pathway (
pathname) for which the selected sample has at least one associated KO. -
The set of axes forms an inventory of the pathway space encoded in that sample.
-
Radius (r – Pathway KO Richness)
- The distance from the center along each axis is proportional to the count of unique KOs mapped to that pathway in the selected sample.
-
Higher values indicate stronger representation or greater complexity of that pathway in the sample.
-
Polygon Shape (KO Annotation Fingerprint)
- The polygon connecting all axes encodes the overall distribution of KO annotation richness:
- pronounced "spikes" along specific axes may indicate concentrated KO annotation coverage in those pathways
- a more rounded, balanced shape may indicate broad and relatively even KO annotation coverage across pathways
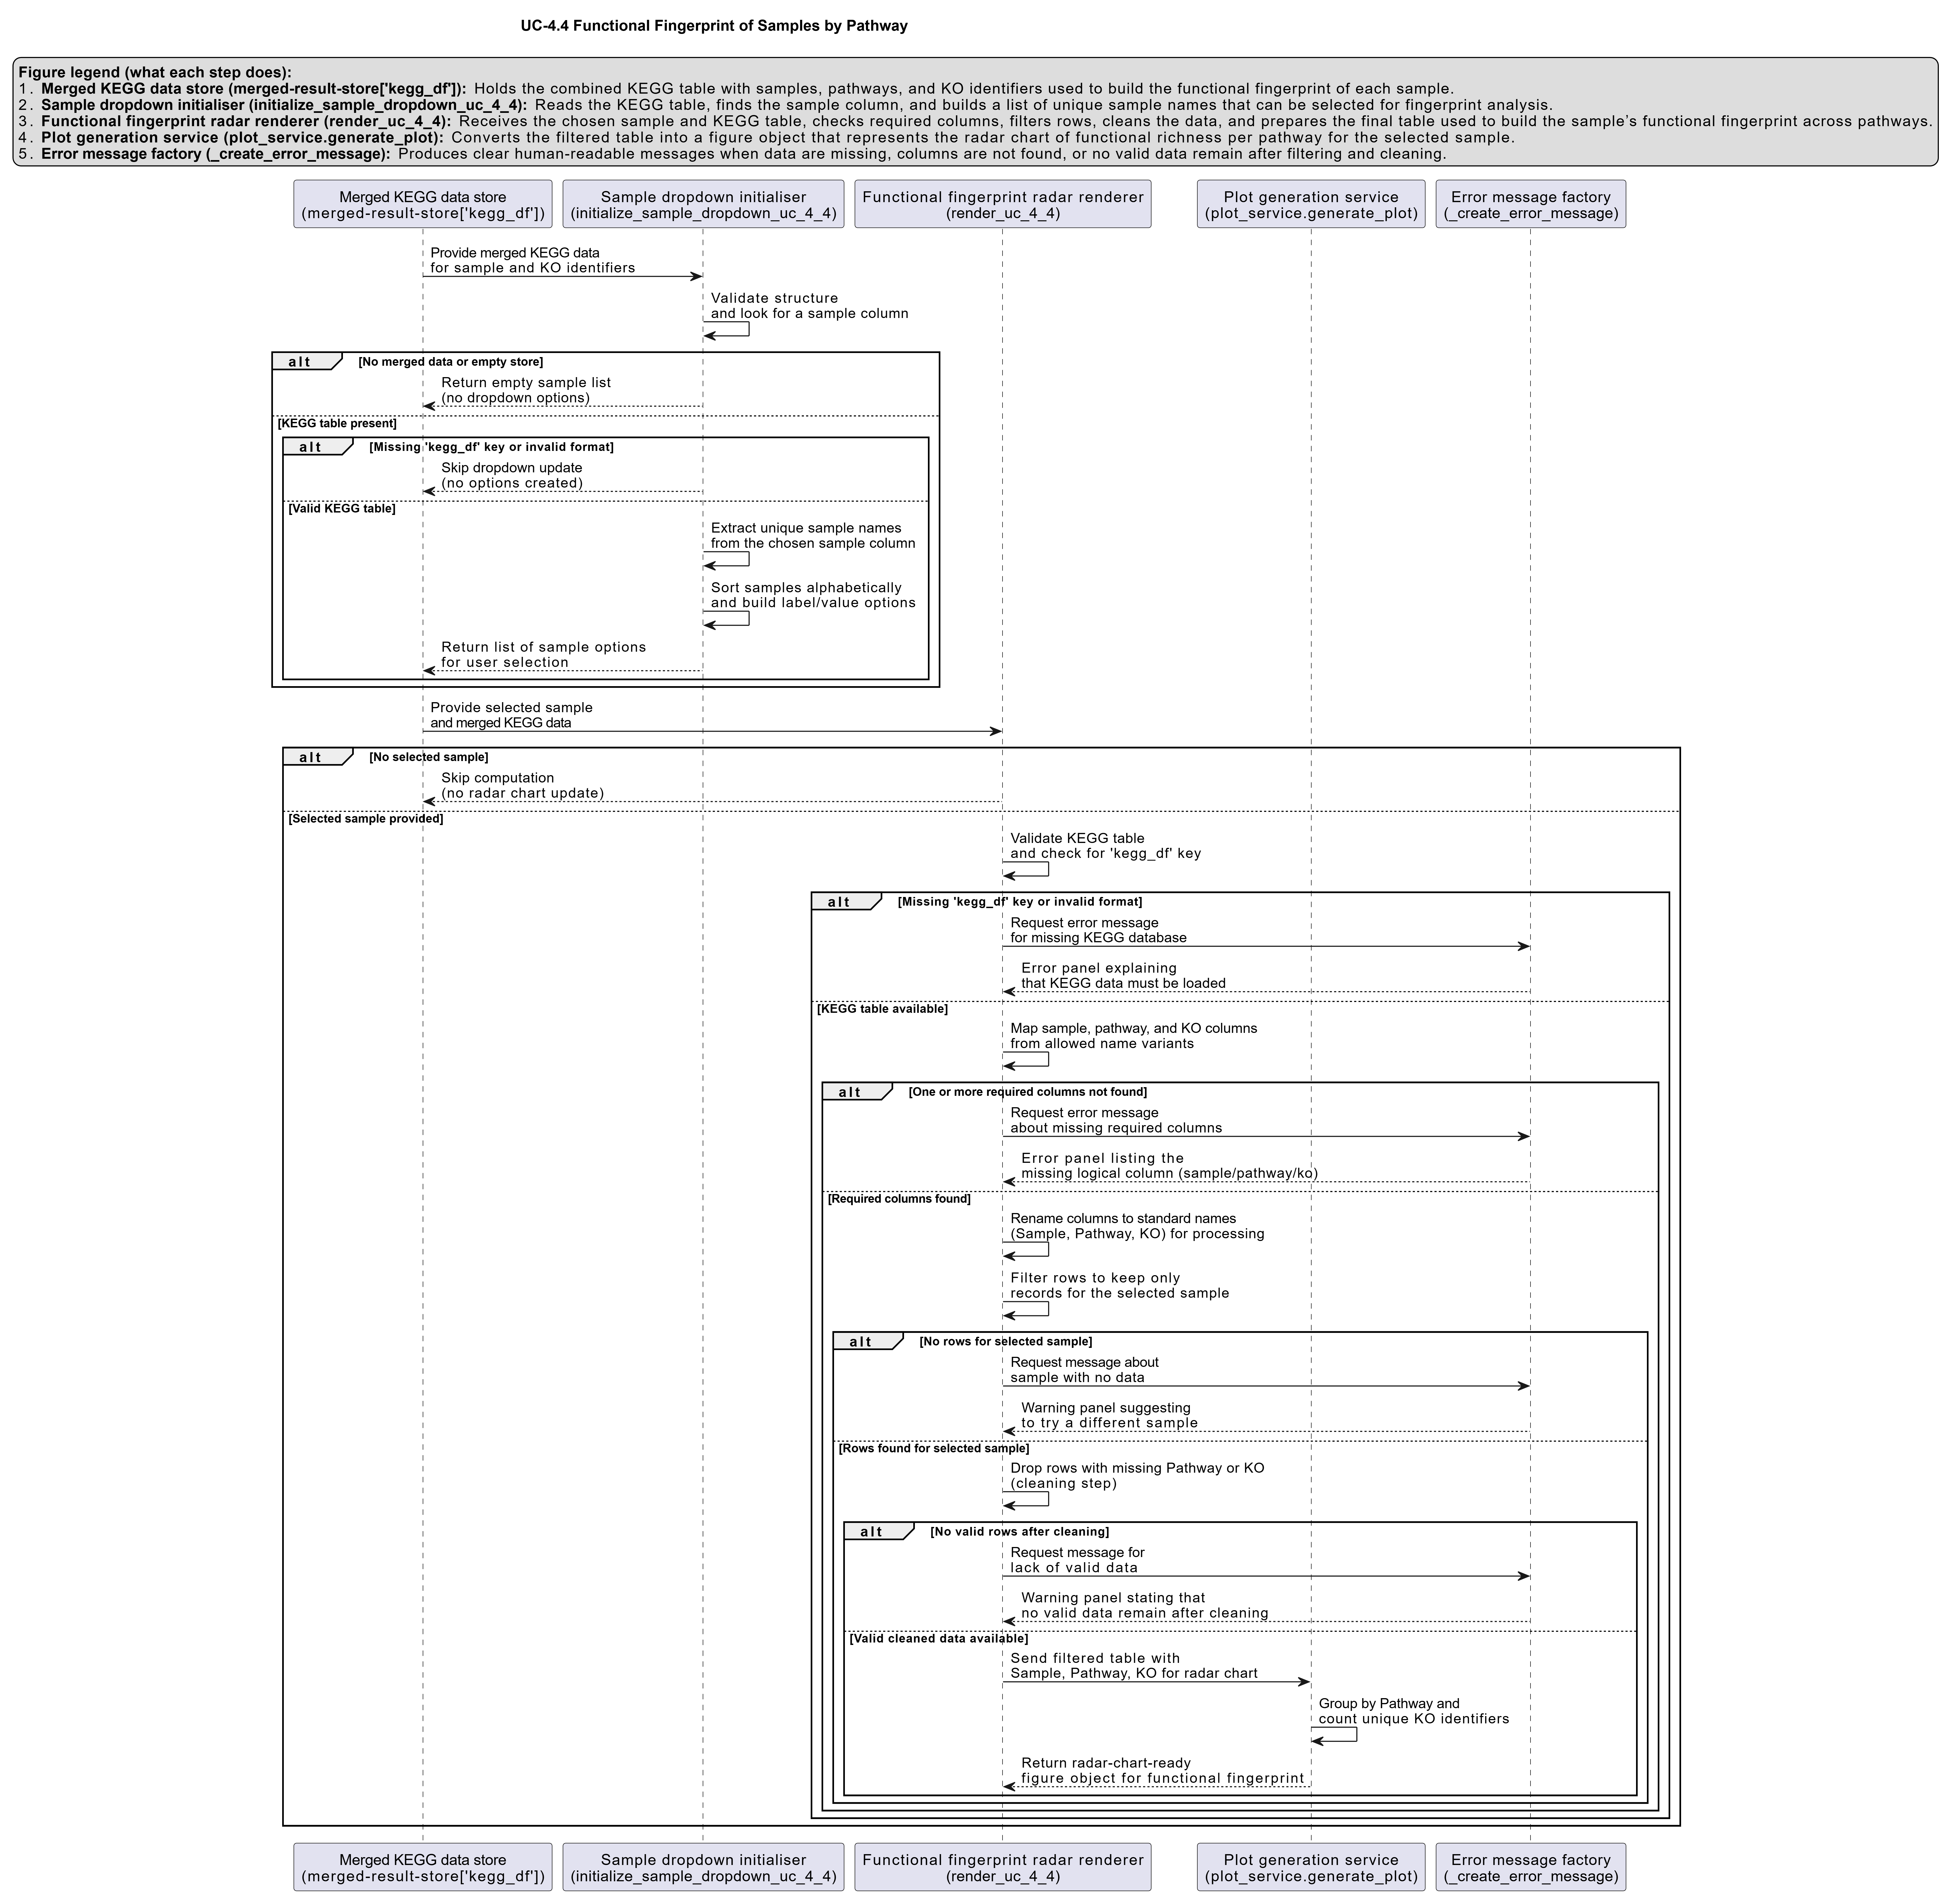
Representative Output
The image below illustrates a representative output generated by this use case using the example dataset.
Click on the image to enlarge and explore details.
Interpretation and Key Messages
- Pathways with Concentrated KO Annotation Coverage
- A radar shape heavily skewed toward a subset of related pathways (e.g., several pathways within the same compound class) may indicate that the sample has concentrated KO annotation coverage in those domains.
-
Such samples may be worth prioritizing for experimental investigation of those pathways (experimental validation required to confirm functional roles).
-
KO Annotation Breadth Across Pathways
- A more circular or evenly expanded polygon may suggest broad KO annotation coverage across many different pathways.
-
These samples may be of interest in scenarios requiring a wide range of annotated pathways to be represented.
-
Comparative Profiling Across Samples
- By switching between samples in the dropdown, users can compare KO annotation fingerprints directly.
-
This can help identify samples with complementary or overlapping KO annotation profiles for annotation-guided hypothesis generation.
-
Link to Other BioRemPP Modules
- When interpreted together with completeness scorecards, toxicity mapping, and regulatory alignment analyses, the KO annotation fingerprint can support annotation-based hypothesis generation and experimental planning.
Reproducibility and Assumptions
- Input Format
The analysis requires a semicolon-delimited KEGG results table containing at least: sample,pathname,-
ko. -
Definition of Pathway Richness
- For each
(sample, pathway)pair, pathway richness is defined as the count of unique KO identifiers mapped to that pathway. -
Multiple occurrences of the same
(sample, pathname, ko)combination do not increase the value; KOs are counted once per pathway per sample. -
Scope and Limitations
- The metric captures KO annotation presence rather than expression, regulation, or actual metabolic flux.
- Radar plots are most interpretable when the number of pathways shown is moderate; in cases with very many low-richness pathways, pre-filtering (e.g., minimum KO count threshold) may be applied for clarity.
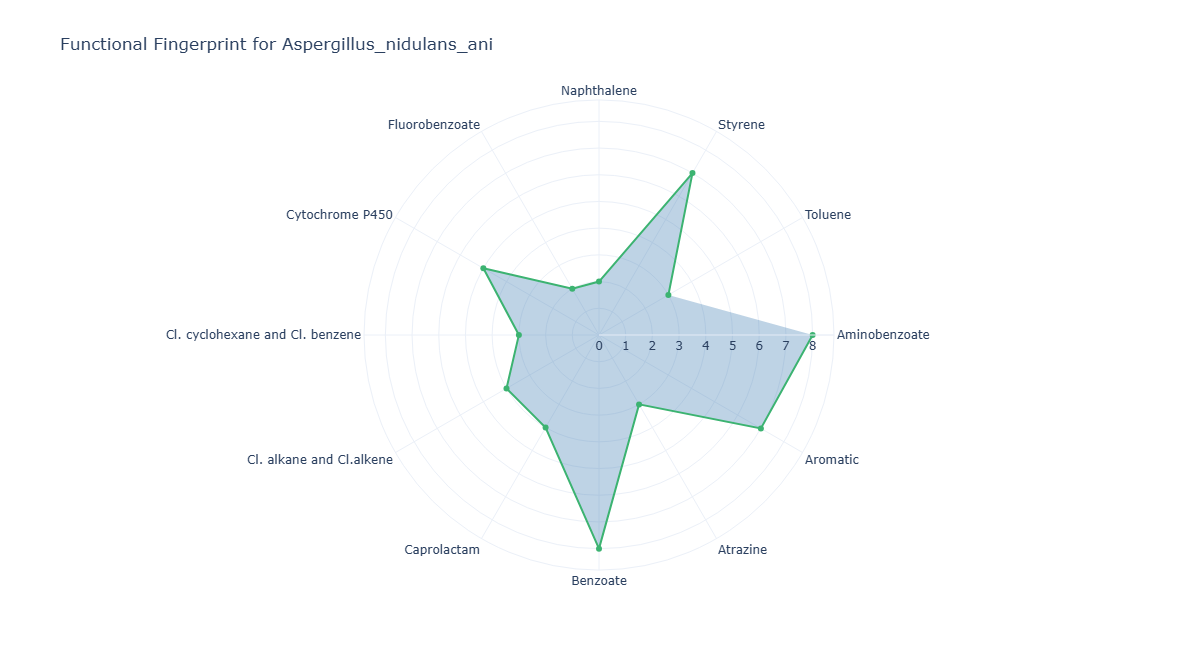
Activity diagram of the use case
Click on the image to enlarge and explore details.