UC-4.5 — Gene Presence Map by Metabolic Pathway
Module: 4 – Functional and Genetic Profiling
Visualization type: Interactive dot (scatter) matrix (gene-by-sample presence for a selected pathway)
Primary inputs: KEGG_Results.xlsx or KEGG_Results.csv (sample–gene–KO–pathway associations)
Primary outputs: Gene presence/absence map across samples for a selected KEGG pathway
Scientific Question and Rationale
Question: For a given metabolic pathway, which specific genes are annotated in which samples, and how do these patterns reveal broadly versus narrowly distributed gene annotations across samples?
This use case focuses on a gene-level view of a single KEGG pathway across all samples, asking:
- which genes may be broadly annotated (widely present) across many or all samples, and
- which gene annotations are restricted to a few samples (narrowly distributed).
By mapping gene symbols vs. samples as a presence/absence dot matrix, the visualization can provide a high-resolution overview of gene annotation patterns and variability across the dataset, supporting comparative annotation-level analyses.
Data and Inputs
- Primary data source:
KEGG_Results.xlsx or KEGG_Results.csv(semicolon-delimited) - Key columns:
sample– identifier for each biological samplepathname– KEGG pathway name or identifiergenesymbol– gene symbol associated with the KO(s) for that pathway-
ko– KEGG Orthology identifier(s) linked to the gene and pathway -
User control:
-
A dropdown menu to select a single Metabolic Pathway (
pathname) for inspection. -
Output structure:
- X-axis: samples
- Y-axis: gene symbols associated with the selected pathway
- Dots: presence of a given gene in a given sample for that pathway, optionally with KO-based summaries in hover
Analytical Workflow
- Pathway Selection (User Input)
The user selects a metabolic pathway (pathname) from an interactive dropdown menu. -
All subsequent computations are restricted to this selected pathway.
-
Dynamic Filtering
- The KEGG results table
KEGG_Results.xlsx or KEGG_Results.csvis loaded. -
The dataset is filtered to retain only rows where:
pathnameequals the selected pathway, andsample,genesymbol, andkoare valid and non-missing.
-
Extraction of Sample–Gene Pairs
- From the filtered data, the script derives the set of unique (
sample,genesymbol) pairs, representing presence of that gene in that sample for the selected pathway. -
Optionally, for each pair, a summary count of distinct KOs can be calculated to enrich hover information.
-
Rendering as Gene Presence Map
- A dot (scatter) matrix is constructed where:
- the X-axis lists samples
- the Y-axis lists gene symbols associated with the pathway
- each point indicates that the corresponding sample encodes that gene in the context of the selected pathway
- Points may carry additional hover metadata (e.g., number of distinct KOs per sample–gene pair).
How to Read the Plot
- Dropdown Menu (Pathway Selection)
- Use the menu to choose the Metabolic Pathway of interest.
-
The gene–sample matrix updates automatically for the selected pathway.
-
Y-axis – Gene Symbols
- Each horizontal row corresponds to a Gene Symbol associated with the selected pathway.
-
The set of rows collectively defines the gene inventory for that pathway in the dataset.
-
X-axis – Samples
- Each vertical column represents a Sample.
-
All samples that encode at least one gene for the selected pathway are shown.
-
Dots (Presence Events)
- A dot at the intersection of a gene row and a sample column indicates that the sample encodes that gene for the selected pathway.
- Hover information can include:
- sample identifier
- gene symbol
- number of distinct KOs mapped to that gene in that sample for this pathway
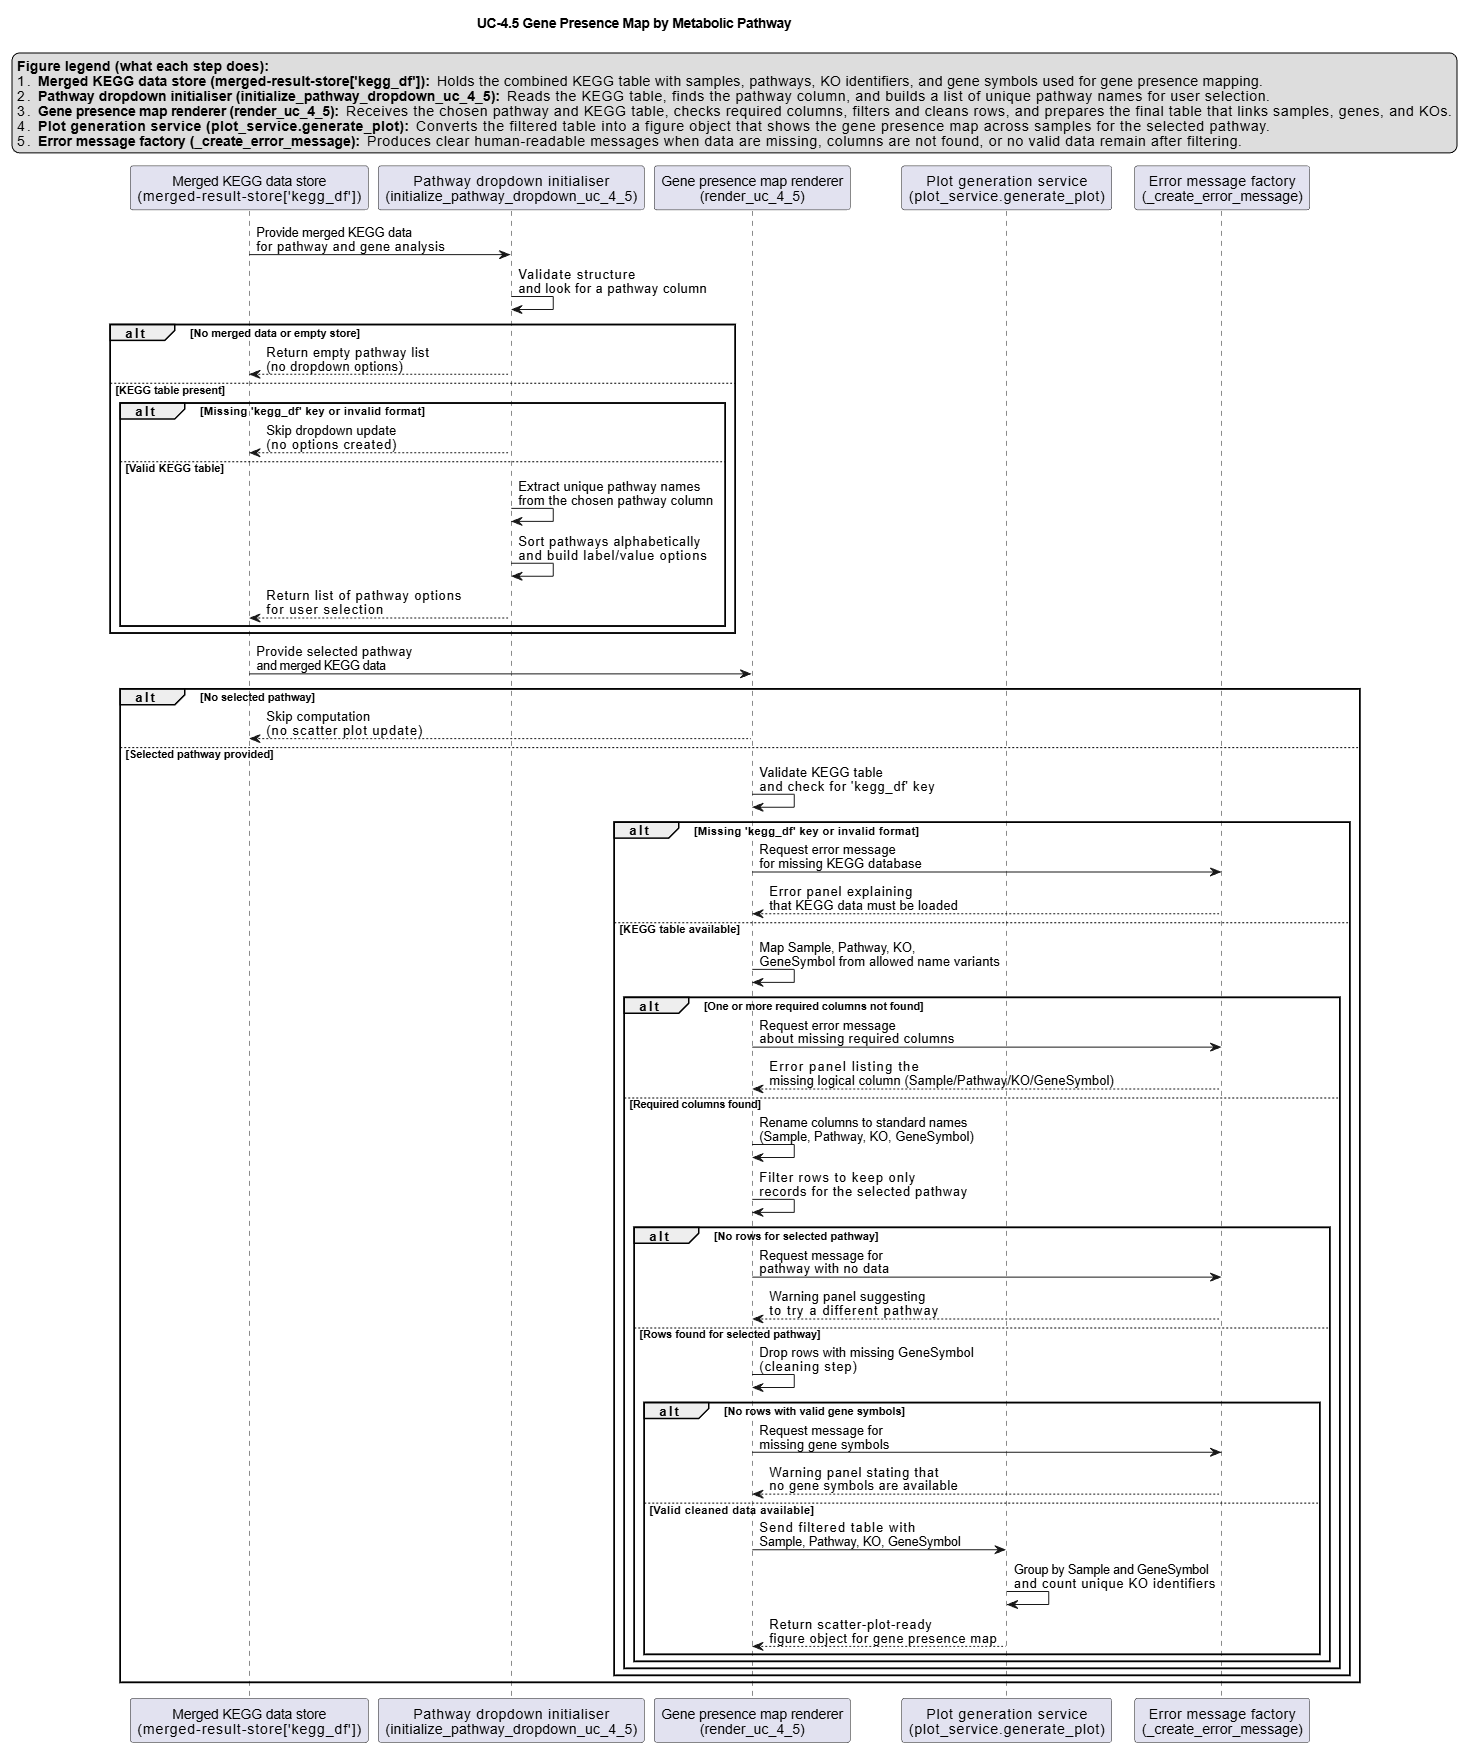
Representative Output
The image below illustrates a representative output generated by this use case using the example dataset.
Click on the image to enlarge and explore details.
Interpretation and Key Messages
- Broadly vs. Narrowly Distributed Gene Annotations
- Genes forming nearly continuous horizontal rows of dots across many samples may represent broadly distributed annotations for that pathway in this dataset.
-
Genes with only a few dots (restricted to one or a small subset of samples) represent narrowly distributed gene annotations, which may be worth noting for annotation-guided hypothesis generation.
-
Gene Annotation Density per Sample
- The vertical density of dots in a given sample column may reflect how many genes of the pathway are annotated in that sample.
-
Columns with many genes present may indicate higher KO annotation coverage for that pathway, while sparse columns may indicate fewer annotated genes for that pathway.
-
Annotation-level Comparative Analysis
-
By inspecting patterns of shared and unique gene presence, one can:
- identify samples with similar gene annotation patterns (annotation redundancy),
- recognize samples whose gene annotations cover different subsets of the pathway, and
- identify samples that carry uniquely annotated genes for that pathway.
-
Annotation-guided Hypothesis Generation
- Comparing gene annotation patterns across samples can support annotation-based reasoning about which samples or combinations may be worth investigating experimentally for that pathway (experimental validation required to confirm gene function).
Reproducibility and Assumptions
- Input Format
The analysis requires a semicolon-delimited table with at least: sample,pathname,genesymbol,-
ko. -
Definition of Presence
-
A gene is considered present in a sample for the selected pathway if there is at least one row in the filtered data linking that
sample,genesymbol, andpathnamevia one or morekoidentifiers. -
Scope and Limitations
- The visualization captures annotated gene presence, not expression, regulation, or confirmed functional activity.
- The set of genes and KOs is determined entirely by the input file; it does not incorporate external knowledge about canonical pathway completeness beyond what is represented in the dataset.
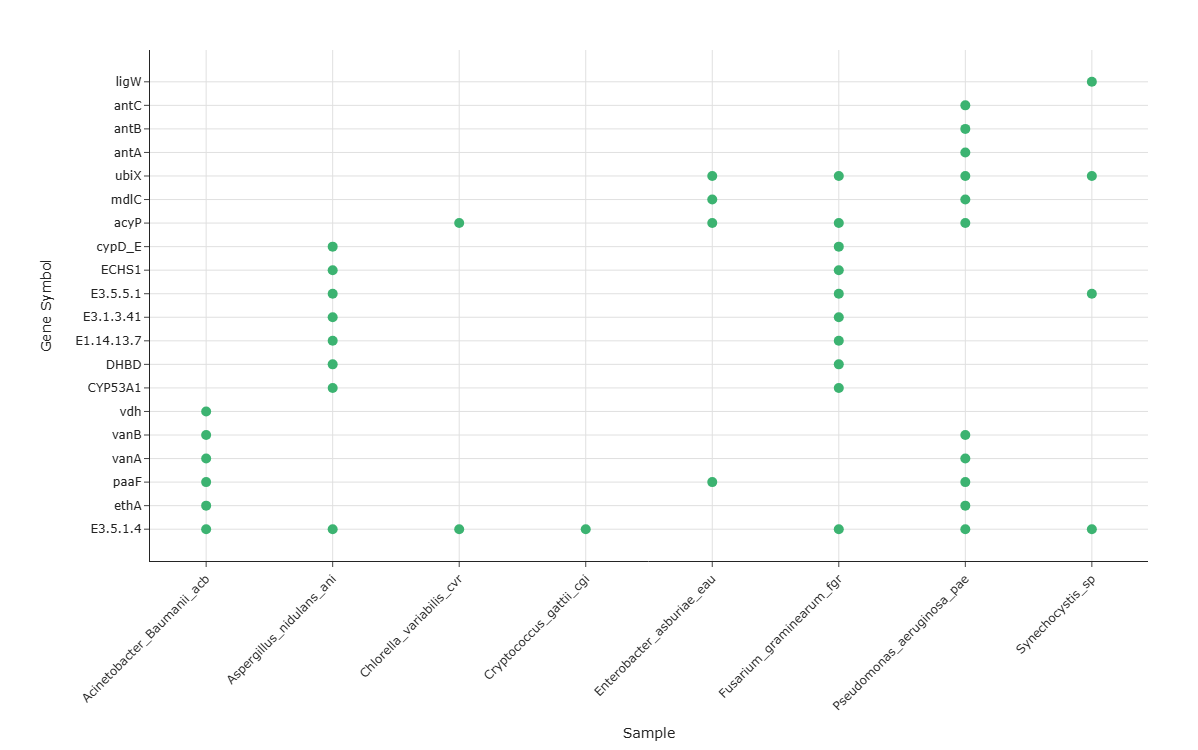
Activity diagram of the use case
Click on the image to enlarge and explore details.