UC-4.6 — Functional Potential by Chemical Compound
Module: 4 – Functional and Genetic Profiling
Visualization type: Interactive scatter (sample–compound matrix with KO-based intensity)
Primary inputs: BioRemPP_Results.xlsx or BioRemPP_Results.csv (sample–compound–KO associations, with chemical class)
Primary outputs: Sample–compound functional potential map for a selected chemical class
Scientific Question and Rationale
Question: For a given class of chemical compounds, which samples have the highest KO annotation diversity co-annotated with specific compounds?
Instead of asking only whether a sample is co-annotated with a compound, this use case quantifies how many unique KEGG Orthology (KO) identifiers are associated with each (sample, compound) pair in the dataset, providing a measure of KO annotation diversity at compound resolution.
By filtering on a chemical class and summarizing unique KO counts for each (sample, compound) pair, the visualization creates a two-dimensional KO annotation landscape, where "hotspots" (large, bright points) may identify sample–compound combinations with particularly high KO annotation diversity (experimental validation required to confirm functional roles).
Data and Inputs
- Primary data source:
BioRemPP_Results.xlsx or BioRemPP_Results.csv(semicolon-delimited) - Key columns:
sample– identifier for each biological samplecompoundclass– chemical class for each compoundcompoundname– individual compound names-
ko– KEGG Orthology identifier(s) associated with each sample–compound interaction -
User control:
-
A dropdown menu to select the Compound Class (
compoundclass) to be analyzed. -
Output structure:
- X-axis: samples
- Y-axis: compounds (within the selected class)
- Point size/color: unique KO count for each
(sample, compound)pair (functional potential)
Analytical Workflow
- Compound Class Selection (User Input)
The user selects a chemical class (compoundclass) from an interactive dropdown menu. -
All subsequent filtering and aggregation are restricted to compounds belonging to this class.
-
Dynamic Filtering
- The results table
BioRemPP_Results.xlsx or BioRemPP_Results.csvis loaded. -
The dataset is filtered to retain only rows where:
compoundclassequals the selected class, andsample,compoundname, andkoare valid and non-missing.
-
Aggregation of KO Annotation Diversity
- The filtered data is grouped by
(sample, compoundname). - For each
(sample, compoundname)pair, the number of distinct KO identifiers is computed (e.g.,nunique()onko). -
This yields a table where each row encodes:
sample,compoundname,unique_ko_count(the KO annotation diversity metric).
-
Rendering as Sample–Compound Scatter Map
- The aggregated table is rendered as a scatter (dot) plot where:
- X-axis:
sample, - Y-axis:
compoundname, - Marker size and color: proportional to
unique_ko_count.
- X-axis:
- A continuous color bar provides a quantitative legend for the KO-based functional potential.
How to Read the Plot
- Dropdown Menu (Chemical Class Selection)
- Use the menu to select the Compound Class of interest (e.g., aromatics, chlorinated compounds).
-
The plot automatically updates to show only compounds and interactions within that class.
-
Y-axis – Compound Names
- Each horizontal position corresponds to an individual Compound (
compoundname) within the selected class. -
Reading along the row reveals which samples interact with that compound and with what KO diversity.
-
X-axis – Samples
- Each vertical position corresponds to a Sample.
-
Reading down the column reveals which compounds of the selected class are targeted by that sample and with what level of functional potential.
-
Marker Size and Color – Functional Potential
- Each point represents a sample–compound interaction.
- Marker size and color intensity are both mapped to the count of unique KOs (
unique_ko_count) for that co-annotation:- larger, brighter markers indicate higher KO annotation diversity
- smaller, paler markers indicate lower KO annotation diversity
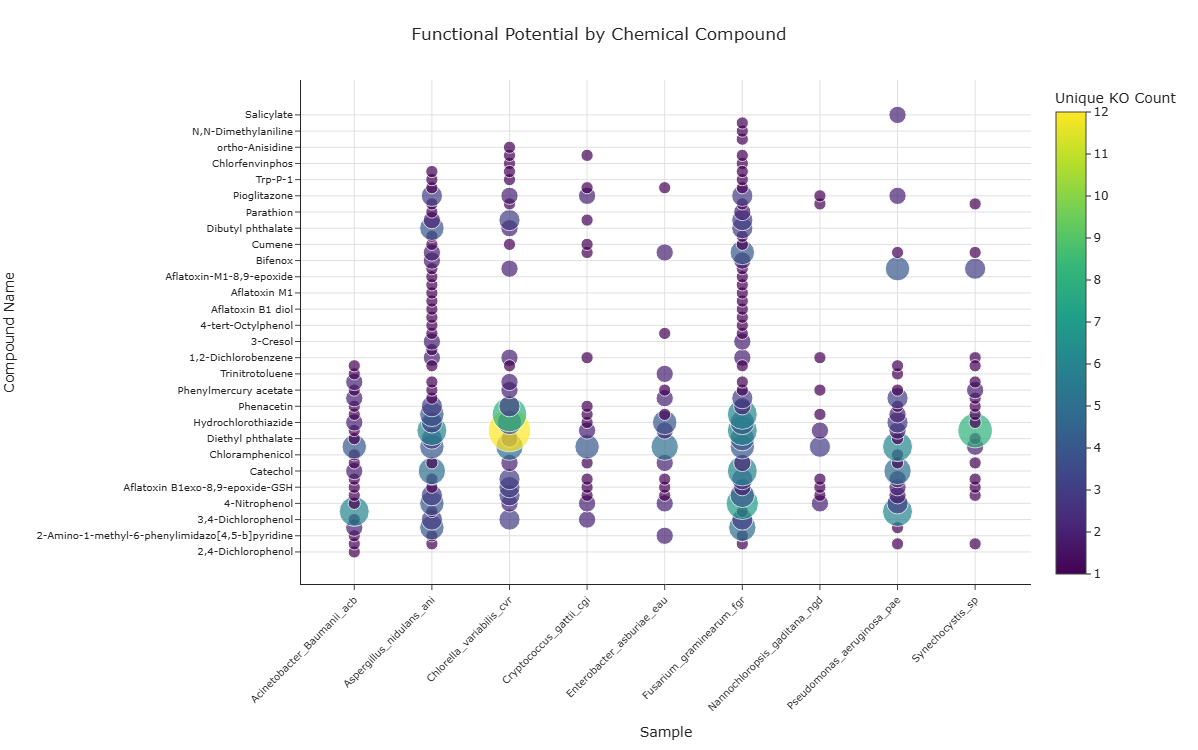
Representative Output
The image below illustrates a representative output generated by this use case using the example dataset.
Click on the image to enlarge and explore details.
Interpretation and Key Messages
- KO Annotation Hotspots
- Large, brightly colored points may mark hotspots of high KO annotation diversity, where a sample has many unique KOs co-annotated with a specific compound.
-
These hotspots could highlight sample–compound pairs worth prioritizing for annotation-guided experimental investigation (experimental validation required to confirm functional roles).
-
Sample-Level KO Annotation Breadth
- A sample whose column contains many large, bright markers has high KO annotation diversity across multiple compounds in that class.
-
Columns dominated by smaller markers or sparse points may indicate lower KO annotation diversity for compounds in that class.
-
Compound-Level KO Annotation Patterns
- A compound row with large, bright markers for several different samples may suggest that the compound has high KO annotation diversity across the dataset.
-
Conversely, compounds with only a few small markers may have fewer annotated KOs in the dataset, which could reflect the compound's representation in the annotation database rather than any inherent property.
-
Annotation-guided Exploration
- By visually inspecting which samples have the highest KO annotation diversity for which compounds, users can:
- identify samples with broad KO annotation coverage for that chemical class, and
- generate annotation-based hypotheses for experimental follow-up.
Reproducibility and Assumptions
- Input Format
The analysis requires a semicolon-delimited table containing at least: sample,compoundclass,compoundname,-
ko. -
Definition of KO Annotation Diversity
- For each
(sample, compoundname)pair, KO annotation diversity is defined as the count of unique KO identifiers co-annotated with that pair in the dataset. -
Multiple rows with the same
(sample, compoundname, ko)combination do not increase the KO count; KOs are considered unique per pair. -
Scope and Limitations
- The metric captures KO annotation co-occurrence, not expression or kinetic performance.
- Higher KO diversity reflects more diverse annotations in the database for that sample–compound pair, not confirmed functional versatility or degradation capacity (experimental validation required).
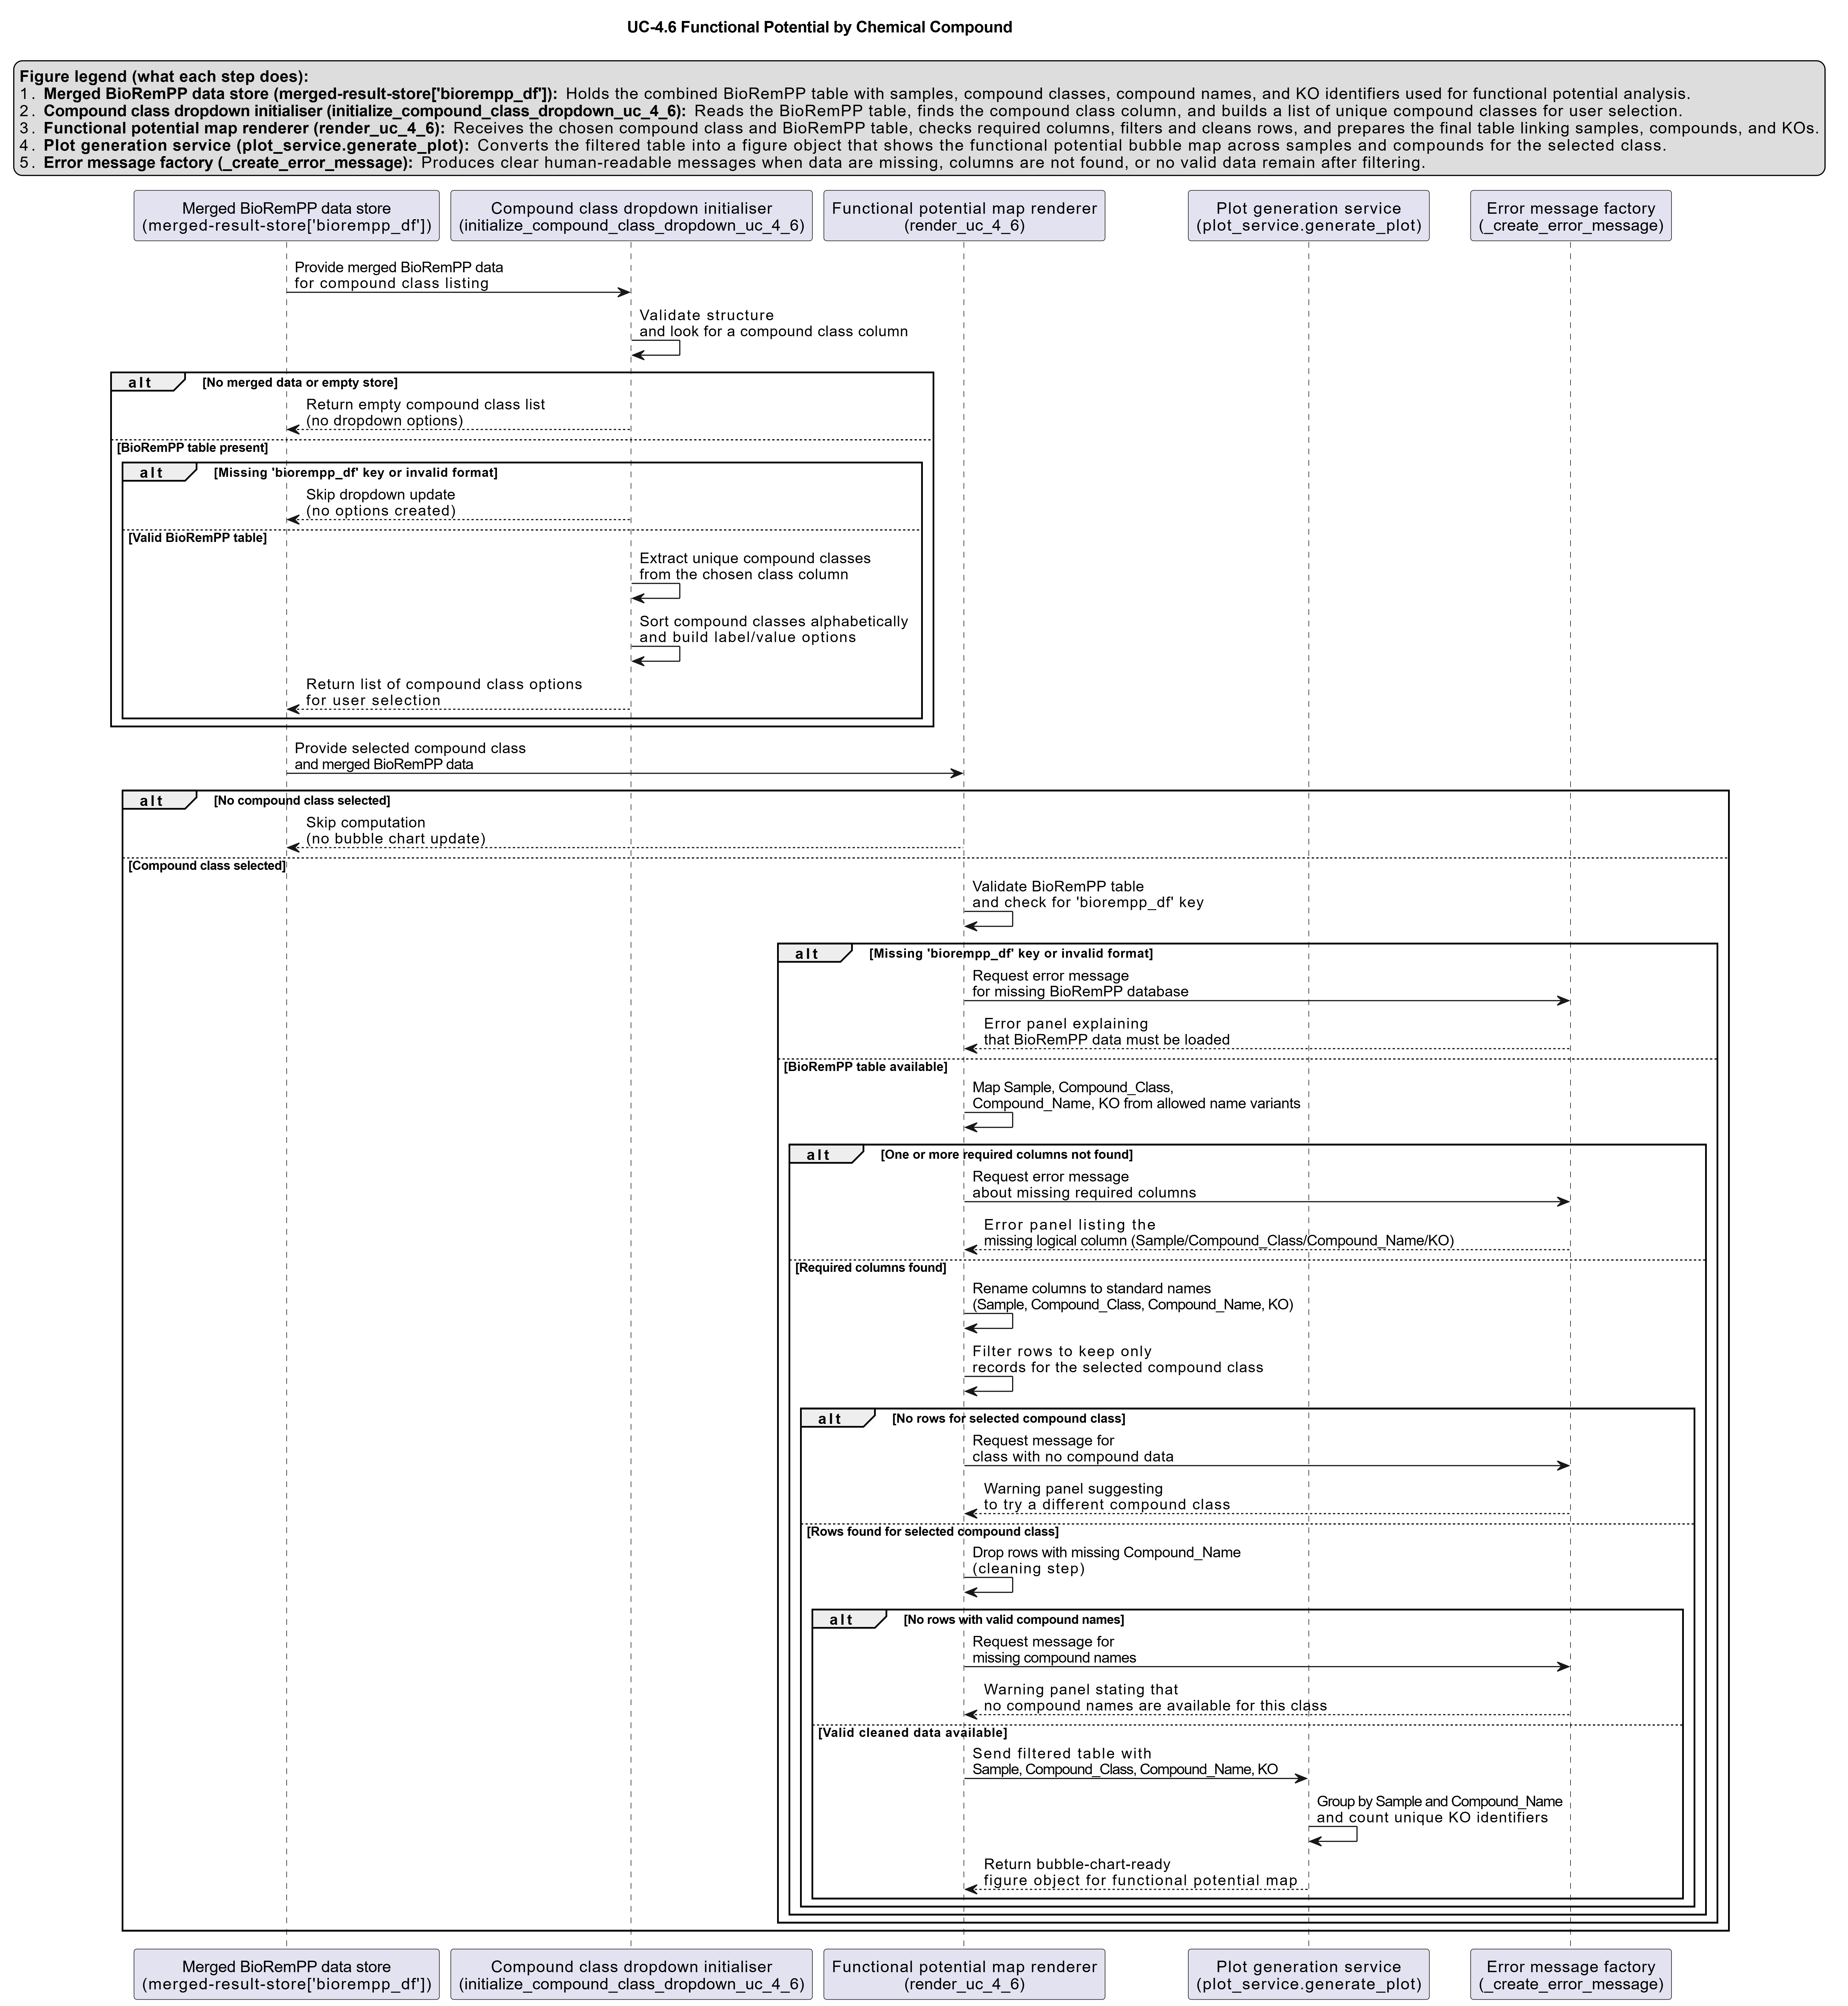
Activity diagram of the use case
Click on the image to enlarge and explore details.