UC-4.7 — Gene–Compound Association Explorer
Module: 4 – Functional and Genetic Profiling
Visualization type: Interactive scatter (gene–compound matrix with sample-level details via hover)
Primary inputs: BioRemPP_Results.xlsx or BioRemPP_Results.csv (sample–compound–gene–KO associations)
Primary outputs: Filterable map of gene–compound associations, with links back to contributing samples
Scientific Question and Rationale
Question: What are the specific co-annotation relationships between individual genes and chemical compounds, and which samples carry these co-annotations?
This use case can provide an exploratory query interface over the BioRemPP annotation table, enabling users to interrogate:
- all genes co-annotated with a given compound (compound-centric view),
- all compounds co-annotated with a given gene (gene-centric view), and
- the subset of samples that carry a specific gene–compound co-annotation.
By exposing gene–compound annotation co-occurrences at full resolution, UC-4.7 and UC-4.8 can support hypothesis generation and identification of gene–compound pairs for downstream experimental investigation (experimental validation required to confirm functional roles).
Data and Inputs
- Primary data source:
BioRemPP_Results.xlsx or BioRemPP_Results.csv(semicolon-delimited) - Key columns:
sample– identifier for each biological samplecompoundname– individual chemical compound namesgenesymbol– gene symbols associated with the interaction-
ko– KEGG Orthology identifier(s) mapped to the gene in that context -
User controls:
- Dropdown – Compound Name:
compoundname(optional filter) -
Dropdown – Gene Symbol:
genesymbol(optional filter) -
Output structure:
- X-axis: gene symbols
- Y-axis: compound names
- Points: observed gene–compound associations, with hover metadata exposing the underlying samples and KOs
Analytical Workflow
- Data Loading
- The results table
BioRemPP_Results.xlsx or BioRemPP_Results.csvis loaded from a semicolon-delimited text file. -
Only rows with non-missing
compoundname,genesymbol, andsampleare retained. -
Widget Initialization (Query Controls)
- Two interactive dropdown menus are created and populated with:
- all unique
compoundnamevalues, and - all unique
genesymbolvalues.
- all unique
-
Both menus support:
- no selection (returns all values along that dimension), and
- selection of a single compound and/or a single gene.
-
Conditional Data Filtering
Based on the user's choices, the table is filtered as follows: - Compound-only selection:
- If only
compoundnameis selected, the data is filtered to all rows matching that compound, across all genes and samples.
- If only
- Gene-only selection:
- If only
genesymbolis selected, the data is filtered to all rows matching that gene, across all compounds and samples.
- If only
-
Compound + gene selection:
- If both are selected, the data is filtered to rows matching that exact
(compoundname, genesymbol)pair.
- If both are selected, the data is filtered to rows matching that exact
-
Association Extraction and Rendering
- From the filtered table, unique combinations of:
compoundname,genesymbol,- associated
sample(and optionallyko), are extracted.
- A scatter-like matrix is rendered:
- X-axis:
genesymbol, - Y-axis:
compoundname, - each point representing at least one observed association between that gene and compound.
- X-axis:
How to Read the Plot
- Dropdown Menus (Query Interface)
- Select Compound Name: filters the visualization to interactions involving that compound.
- Select Gene Symbol: filters the visualization to interactions involving that gene.
- Selecting both returns only the intersection for that gene–compound pair.
-
The scatter updates immediately after each change.
-
Y-axis – Compound Names
- Each position on the vertical axis corresponds to a Compound (
compoundname). -
Multiple points along that row indicate different genes associated with the same compound.
-
X-axis – Gene Symbols
- Each position on the horizontal axis corresponds to a Gene Symbol (
genesymbol). -
Multiple points along that column indicate different compounds associated with the same gene.
-
Points – Gene–Compound Associations
- Each point at the intersection of a gene and a compound indicates that at least one association between them exists in the BioRemPP dataset.
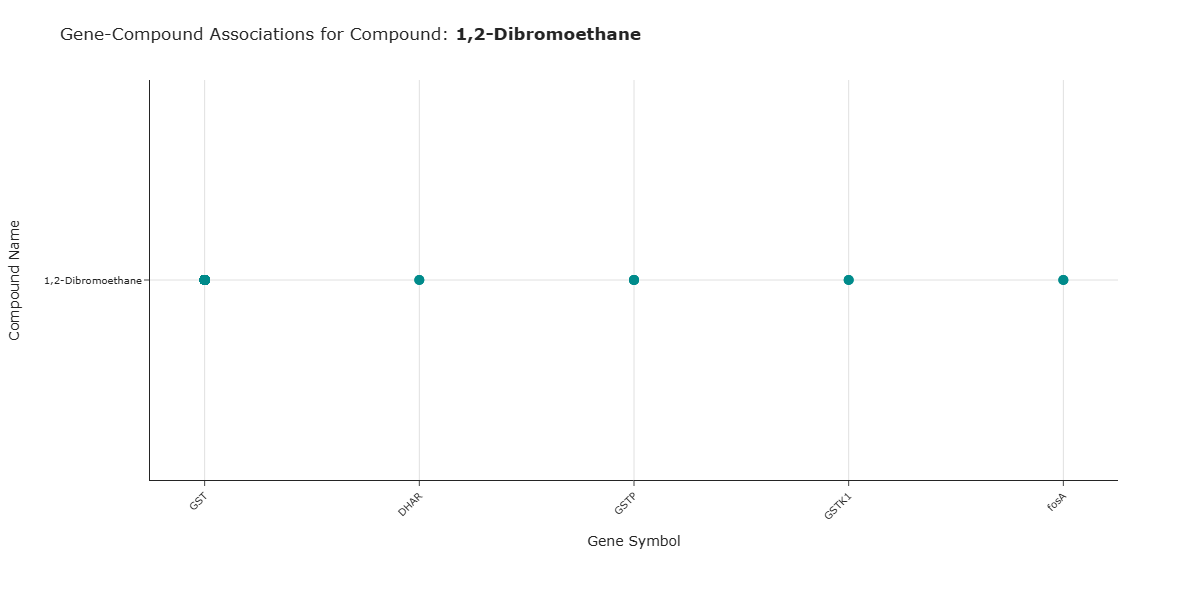
Representative Output
The image below illustrates a representative output generated by this use case using the example dataset.
Click on the image to enlarge and explore details.
Interpretation and Key Messages
- Compound-Centric View
-
Selecting a single compound in the Compound Name dropdown may reveal its gene co-annotation profile:
- the complete set of genes that are co-annotated with that compound across all samples in the dataset.
-
Gene-Centric View
- Selecting a single gene in the Gene Symbol dropdown may reveal its compound co-annotation profile:
- all compounds with which that gene is co-annotated in the dataset.
-
This can help to identify:
- genes co-annotated with many compounds, and
- genes co-annotated with few compounds in the dataset.
-
Dual-Filter View (Targeted Query)
-
Selecting both a gene and a compound asks: "Do this gene and compound co-annotate in any of the samples in the dataset?"
-
Annotation-level Exploration
- By exploring gene–compound co-annotation patterns, one can:
- identify samples carrying unique or rare co-annotations,
- detect widely shared annotation co-occurrences across multiple samples, and
- generate hypotheses about gene–compound relationships for experimental follow-up.
Reproducibility and Assumptions
- Input Format
The analysis requires a semicolon-delimited table containing at least: sample,compoundname,genesymbol,-
ko. -
Association Definition
- A gene–compound association is defined by the presence of at least one row in the BioRemPP results where the same
genesymbolandcompoundnameco-occur. -
The visualization displays presence/absence of associations, not their frequency or expression level.
-
Scope and Limitations
- The approach reflects annotated co-occurrences, not measured activity or kinetics.
- Multiple
koentries per(sample, genesymbol, compoundname)reflect additional functional detail but do not alter the presence of the point itself.
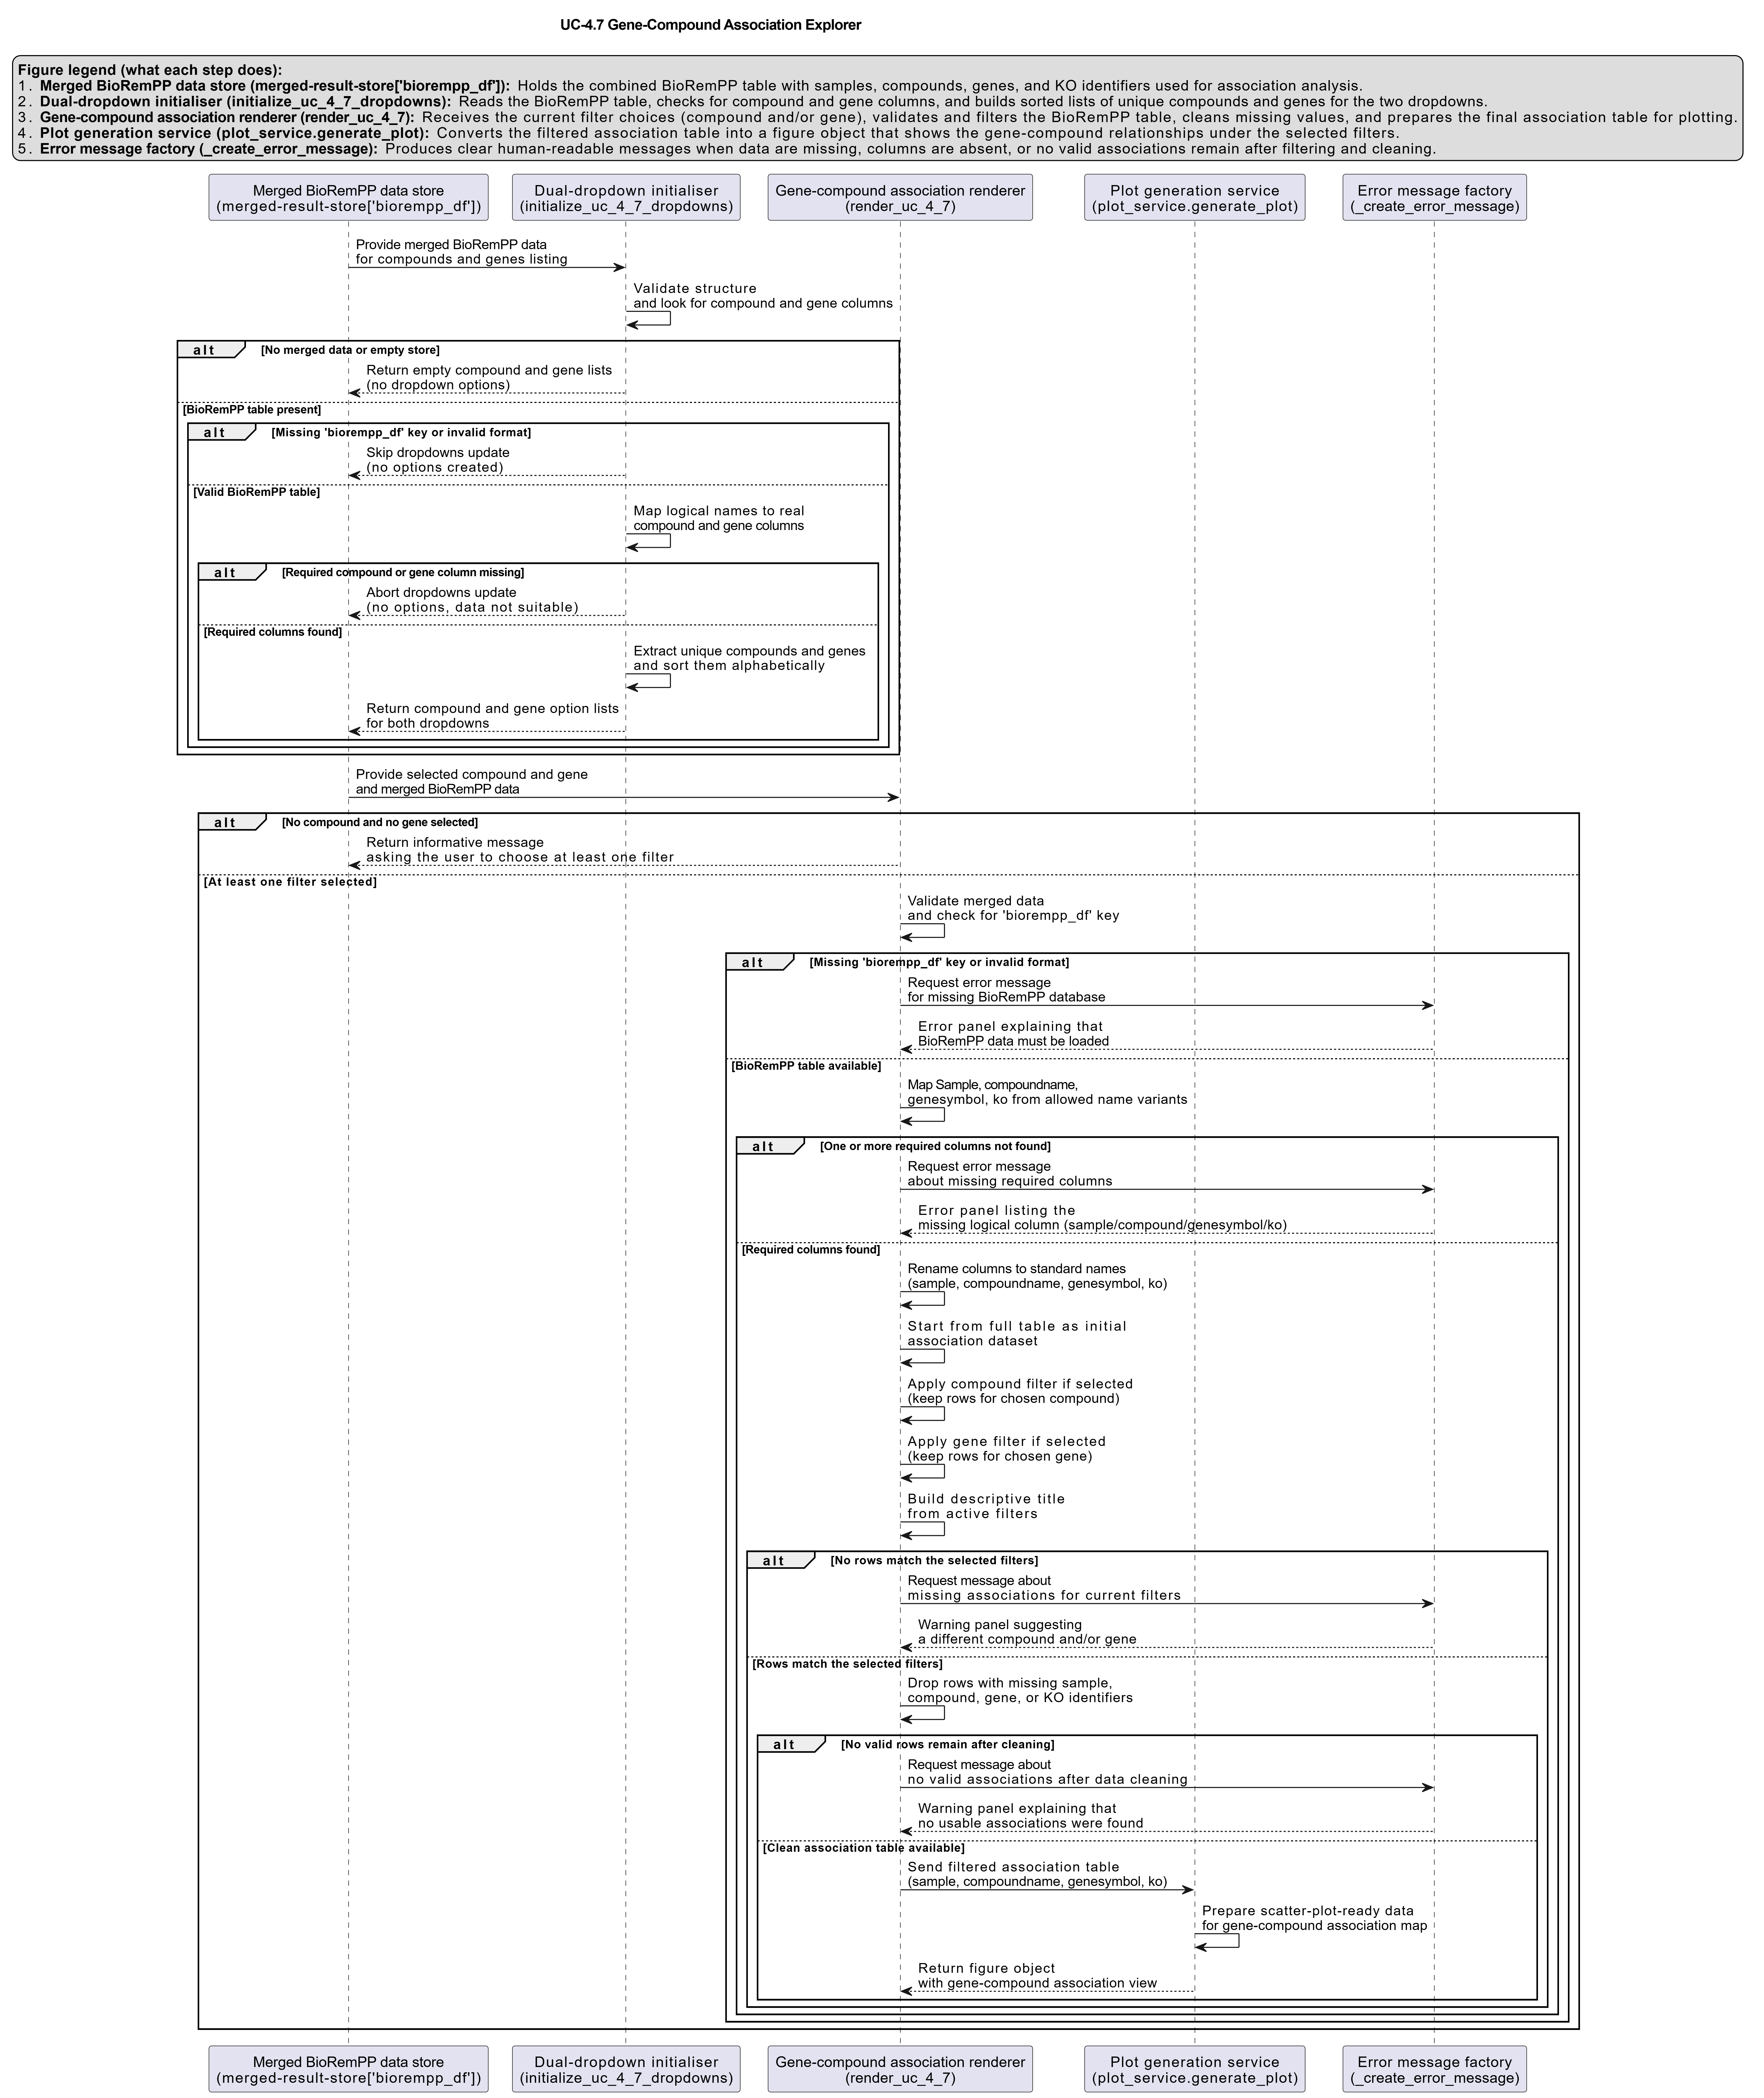
Activity diagram of the use case
Click on the image to enlarge and explore details.