UC-4.8 — Gene Inventory Explorer
Module: 4 – Functional and Genetic Profiling
Visualization type: Interactive scatter (sample–gene matrix with contextual metadata via hover)
Primary inputs: BioRemPP_Results.xlsx or BioRemPP_Results.csv (sample–gene–compound–KO associations)
Primary outputs: Filterable map of gene presence across samples
Scientific Question and Rationale
Question: What is the gene annotation inventory of each sample, and which samples carry a particular gene annotation of interest?
UC-4.8 can provide an exploratory interface to the gene-level annotation composition of the dataset. It may enable users to:
- list all annotated genes present in a given sample (sample-centric view),
- identify which samples carry a specific gene annotation of interest (gene-centric view), and
- inspect the compounds and KOs associated with each sample–gene annotation pair.
This use case can support annotation-level exploration, gene annotation tracking, and hypothesis-driven exploration of the BioRemPP dataset (experimental validation required to confirm gene function).
Data and Inputs
- Primary data source:
BioRemPP_Results.xlsx or BioRemPP_Results.csv(semicolon-delimited) - Key columns:
sample– identifier for each biological samplegenesymbol– gene symbols detected and functionally annotatedcompoundname– compounds associated with that gene in a given sample-
ko– KEGG Orthology identifier(s) mapped to the gene in that context -
User controls:
- Dropdown – Sample: all unique
sampleidentifiers -
Dropdown – Gene Symbol: all unique
genesymbolentries -
Output structure:
- Y-axis: samples
- X-axis: gene symbols
- Points: confirmed presence of a given gene in a given sample, with hover metadata exposing associated compounds and KOs
Analytical Workflow
- Data Loading
- The BioRemPP results table
BioRemPP_Results.xlsx or BioRemPP_Results.csvis loaded from a semicolon-delimited file. -
Rows with missing
sampleorgenesymbolare discarded to ensure valid associations. -
Widget Initialization (Query Controls)
- Two interactive dropdown menus are constructed and populated with:
- all unique
sampleidentifiers, and - all unique
genesymbolvalues.
- all unique
-
Each dropdown supports:
- no selection (no filter on that dimension), and
- selection of a single sample or single gene.
-
Conditional Data Filtering
Depending on the user's choices, the dataset is filtered as follows: -
Sample-only selection:
- If only a
sampleis selected, the table is filtered to rows matching that sample, returning all genes present in that sample.
- If only a
-
Gene-only selection:
- If only a
genesymbolis selected, the table is filtered to rows matching that gene, returning all samples that carry it.
- If only a
-
Sample + gene selection:
- If both a
sampleand agenesymbolare selected, the table is filtered to the rows matching that exact pair. - This confirms the presence of the gene in that sample and retrieves associated
compoundnameandkoinformation.
- If both a
-
No selection:
- If neither filter is set, the full sample–gene association space is visualized (optionally restricted for performance, depending on implementation).
-
Association Extraction and Rendering
- From the filtered table, unique
(sample, genesymbol)pairs are extracted, with their associatedcompoundnameandkocarried as hover metadata. - A scatter-like matrix is rendered where:
- Y-axis:
sample, - X-axis:
genesymbol, - each point marks the presence of that gene in that sample.
- Y-axis:
How to Read the Plot
- Dropdown Menus (Query Interface)
- Select Sample: filters the visualization to genes present in that sample.
- Select Gene Symbol: filters the visualization to samples that carry that gene.
-
Selecting both restricts the view to that specific sample–gene association.
-
Y-axis – Samples
- Each horizontal position corresponds to a Sample.
-
Multiple points along that row indicate different genes present in that sample.
-
X-axis – Gene Symbols
- Each vertical position corresponds to a Gene Symbol.
-
Multiple points along that column indicate different samples that carry that gene.
-
Points – Sample–Gene Presence
- A point at the intersection of a
sampleand agenesymbolsignifies that the gene has been detected and functionally annotated in that sample.
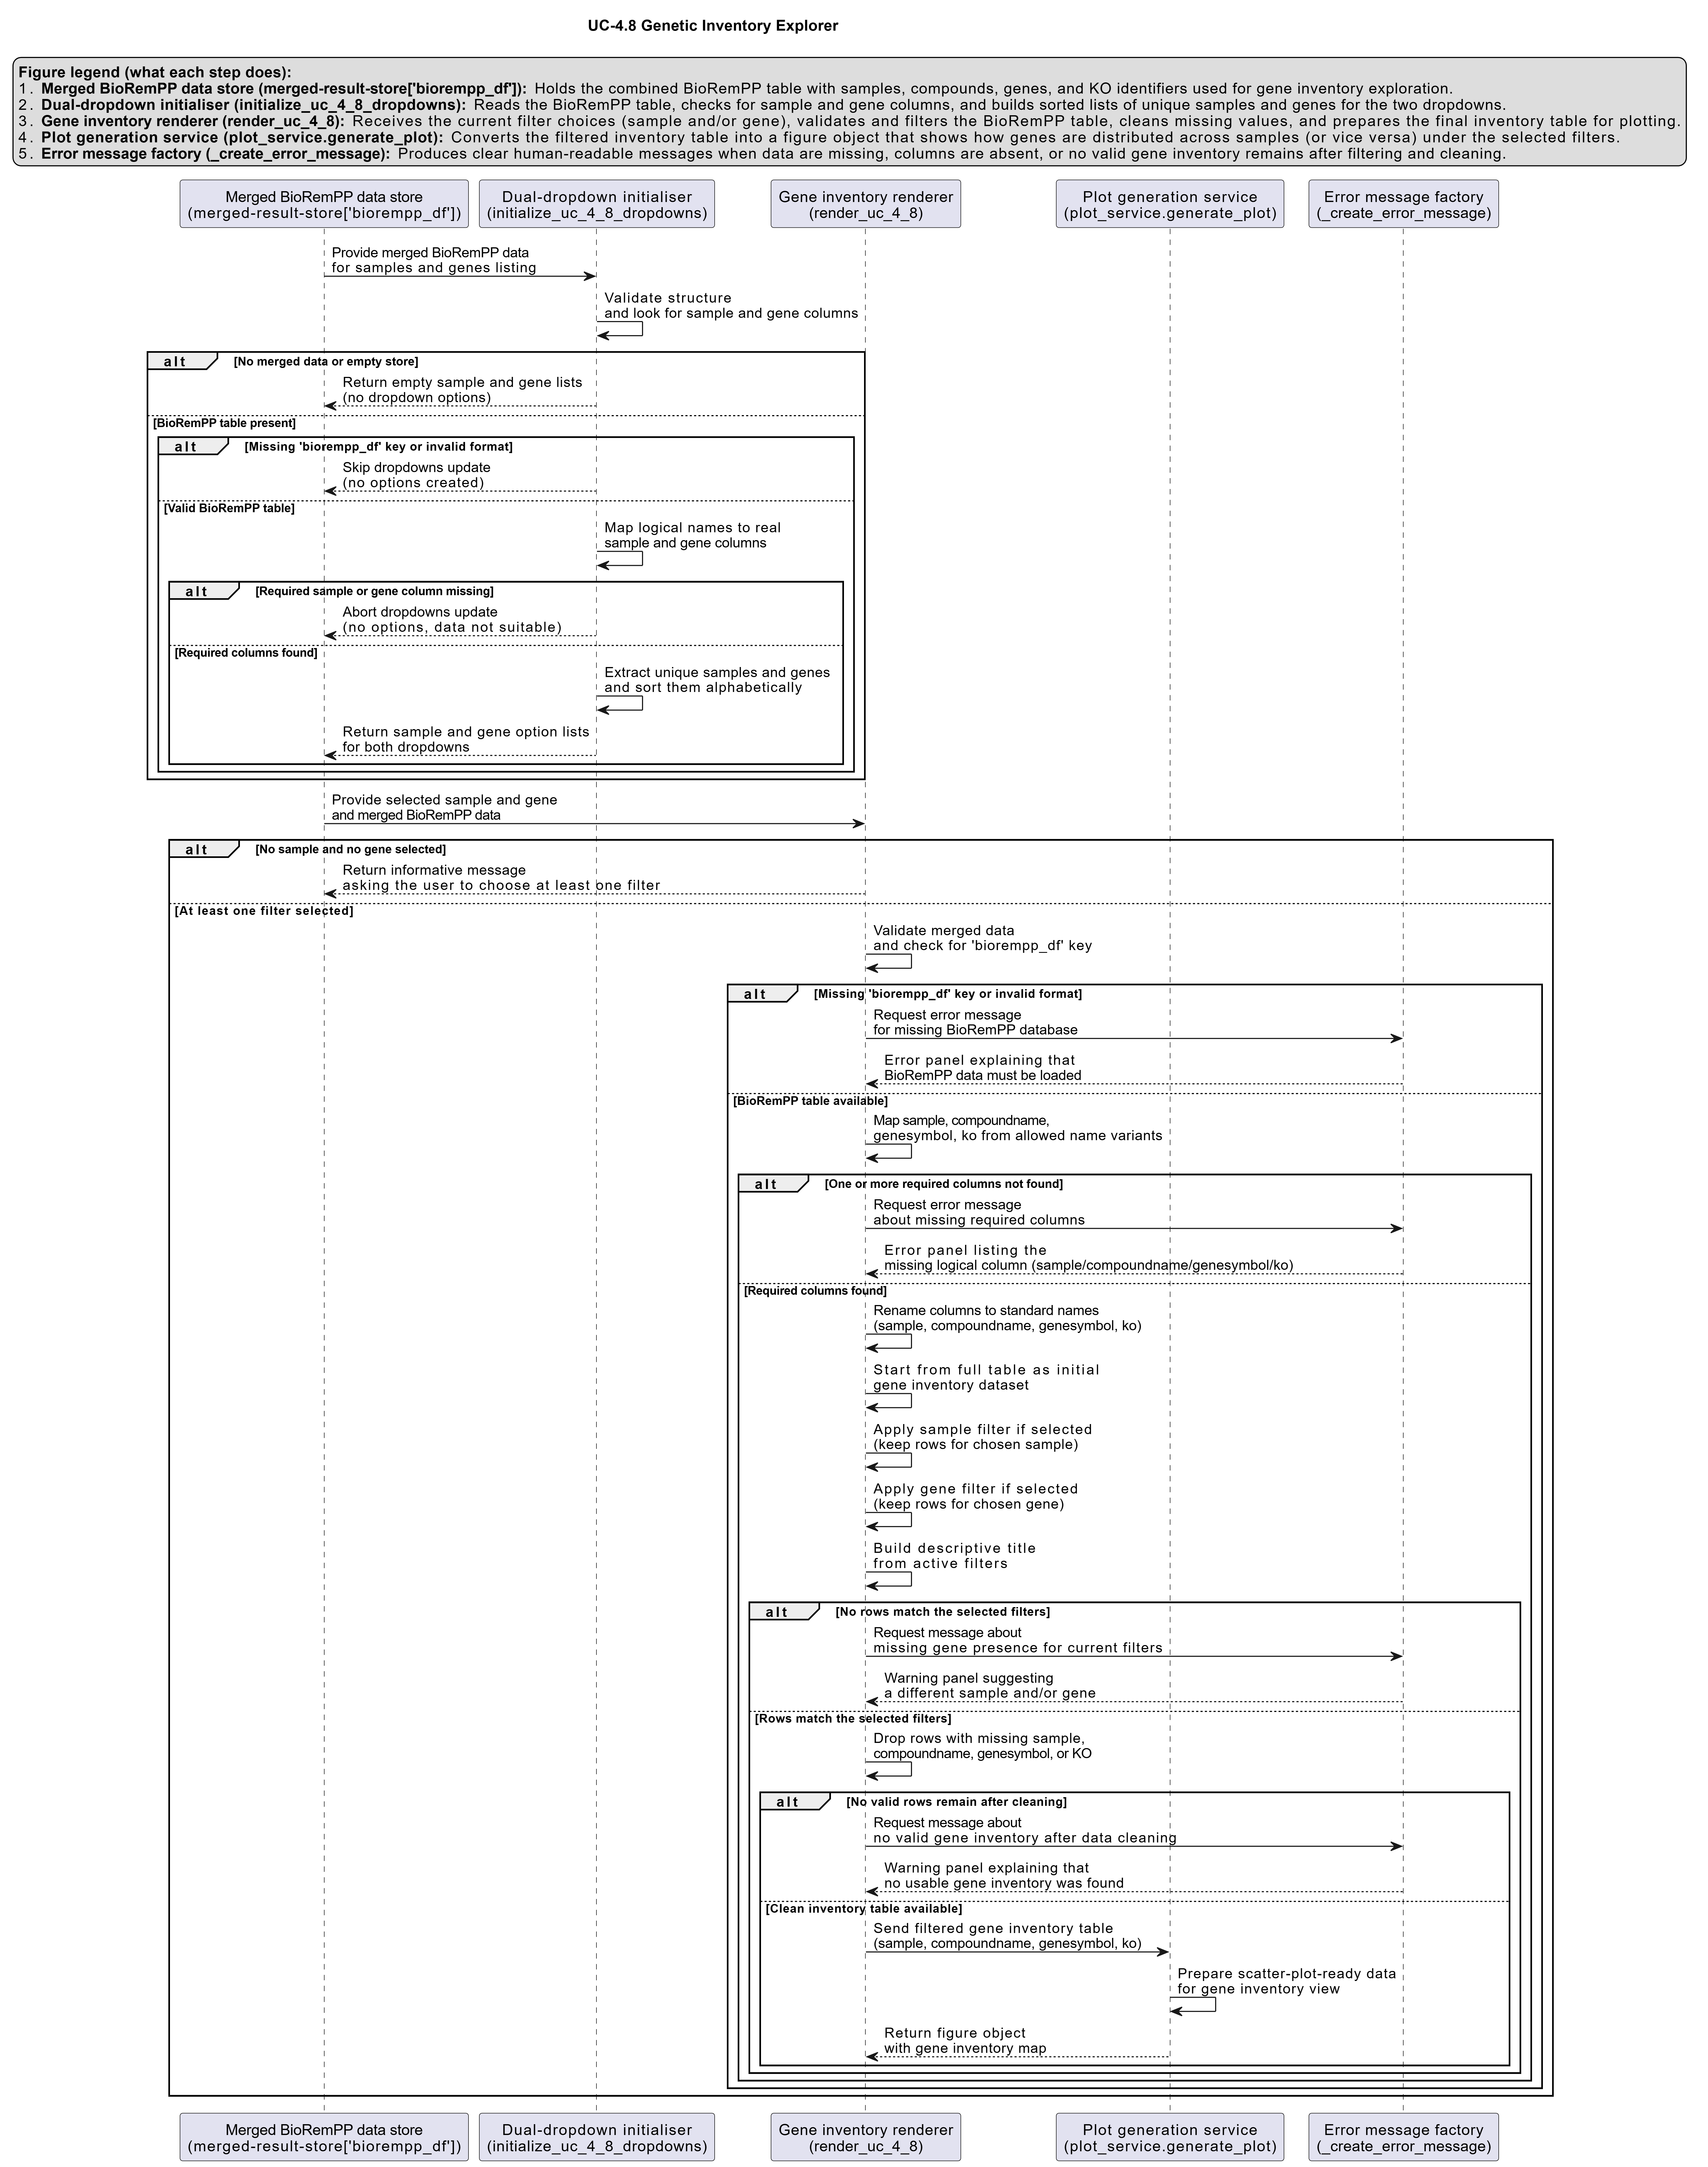
Representative Output
The image below illustrates a representative output generated by this use case using the example dataset.
Click on the image to enlarge and explore details.
Interpretation and Key Messages
- Sample-Centric View (Gene Annotation Inventory)
- Selecting a single sample produces its gene annotation inventory within the BioRemPP dataset:
- the complete set of annotated gene symbols present in that sample.
-
This can help characterize the KO annotation breadth of that sample in the dataset.
-
Gene-Centric View (Distribution Across Samples)
- Selecting a single gene produces its distribution across samples:
- all samples where that gene annotation is present.
-
This can be useful for:
- tracking gene annotations of interest across samples,
- identifying widely annotated vs. rarely annotated genes, and
- examining annotation patterns across the dataset.
-
Dual-Filter View (Targeted Queries)
- Selecting both a sample and a gene confirms whether that gene annotation is present in that sample and, via hover metadata, may reveal:
- the compounds (
compoundname) with which it is co-annotated, and - the underlying KOs (
ko).
- the compounds (
-
This can support targeted annotation exploration, such as verifying whether a candidate sample carries a gene annotation of interest.
-
Annotation-level Comparative Analysis
- By exploring patterns of shared and unique gene annotations across samples, UC-4.8 can aid in:
- identifying broadly shared annotations vs. sample-specific annotations,
- comparing annotation profiles across samples for hypothesis generation, and
- prioritizing samples that carry rare gene annotations worth experimental follow-up.
Reproducibility and Assumptions
- Input Format
The analysis requires a semicolon-delimited table containing at least: sample,genesymbol,compoundname,-
ko. -
Presence Definition
- A sample–gene association (a point in the plot) is defined by the existence of at least one row in the input table where that
sampleandgenesymbolco-occur. -
The visualization captures presence/absence, not copy number, expression level, or interaction frequency.
-
Scope and Limitations
- Results reflect annotated gene presence derived from the BioRemPP workflow, not direct experimental measurements of gene expression or enzyme activity.
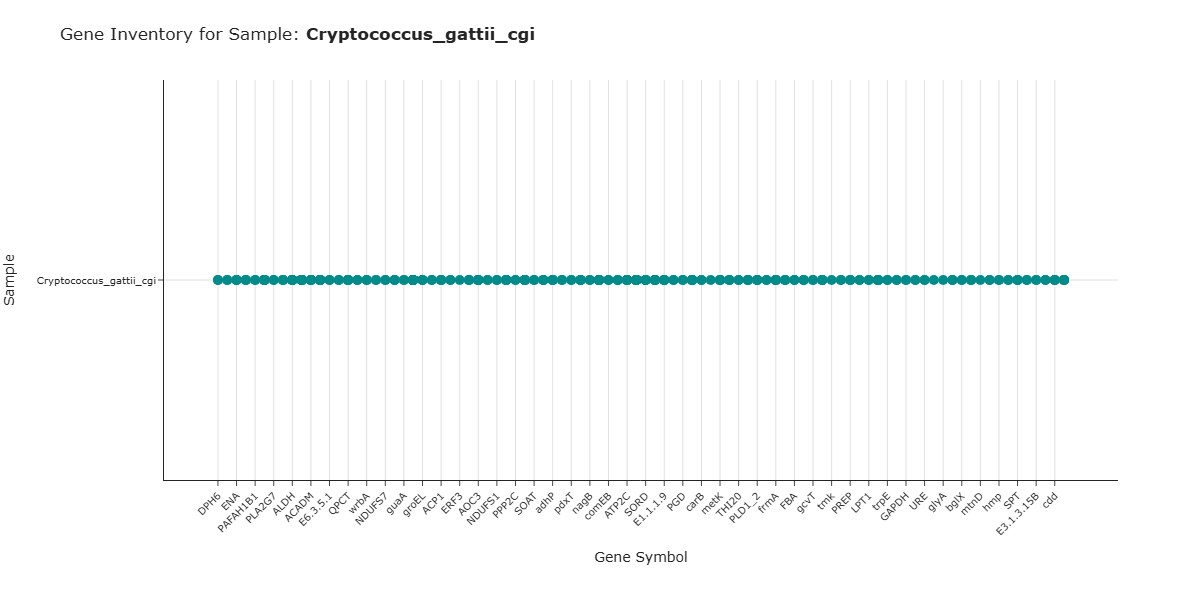
Activity diagram of the use case
Click on the image to enlarge and explore details.