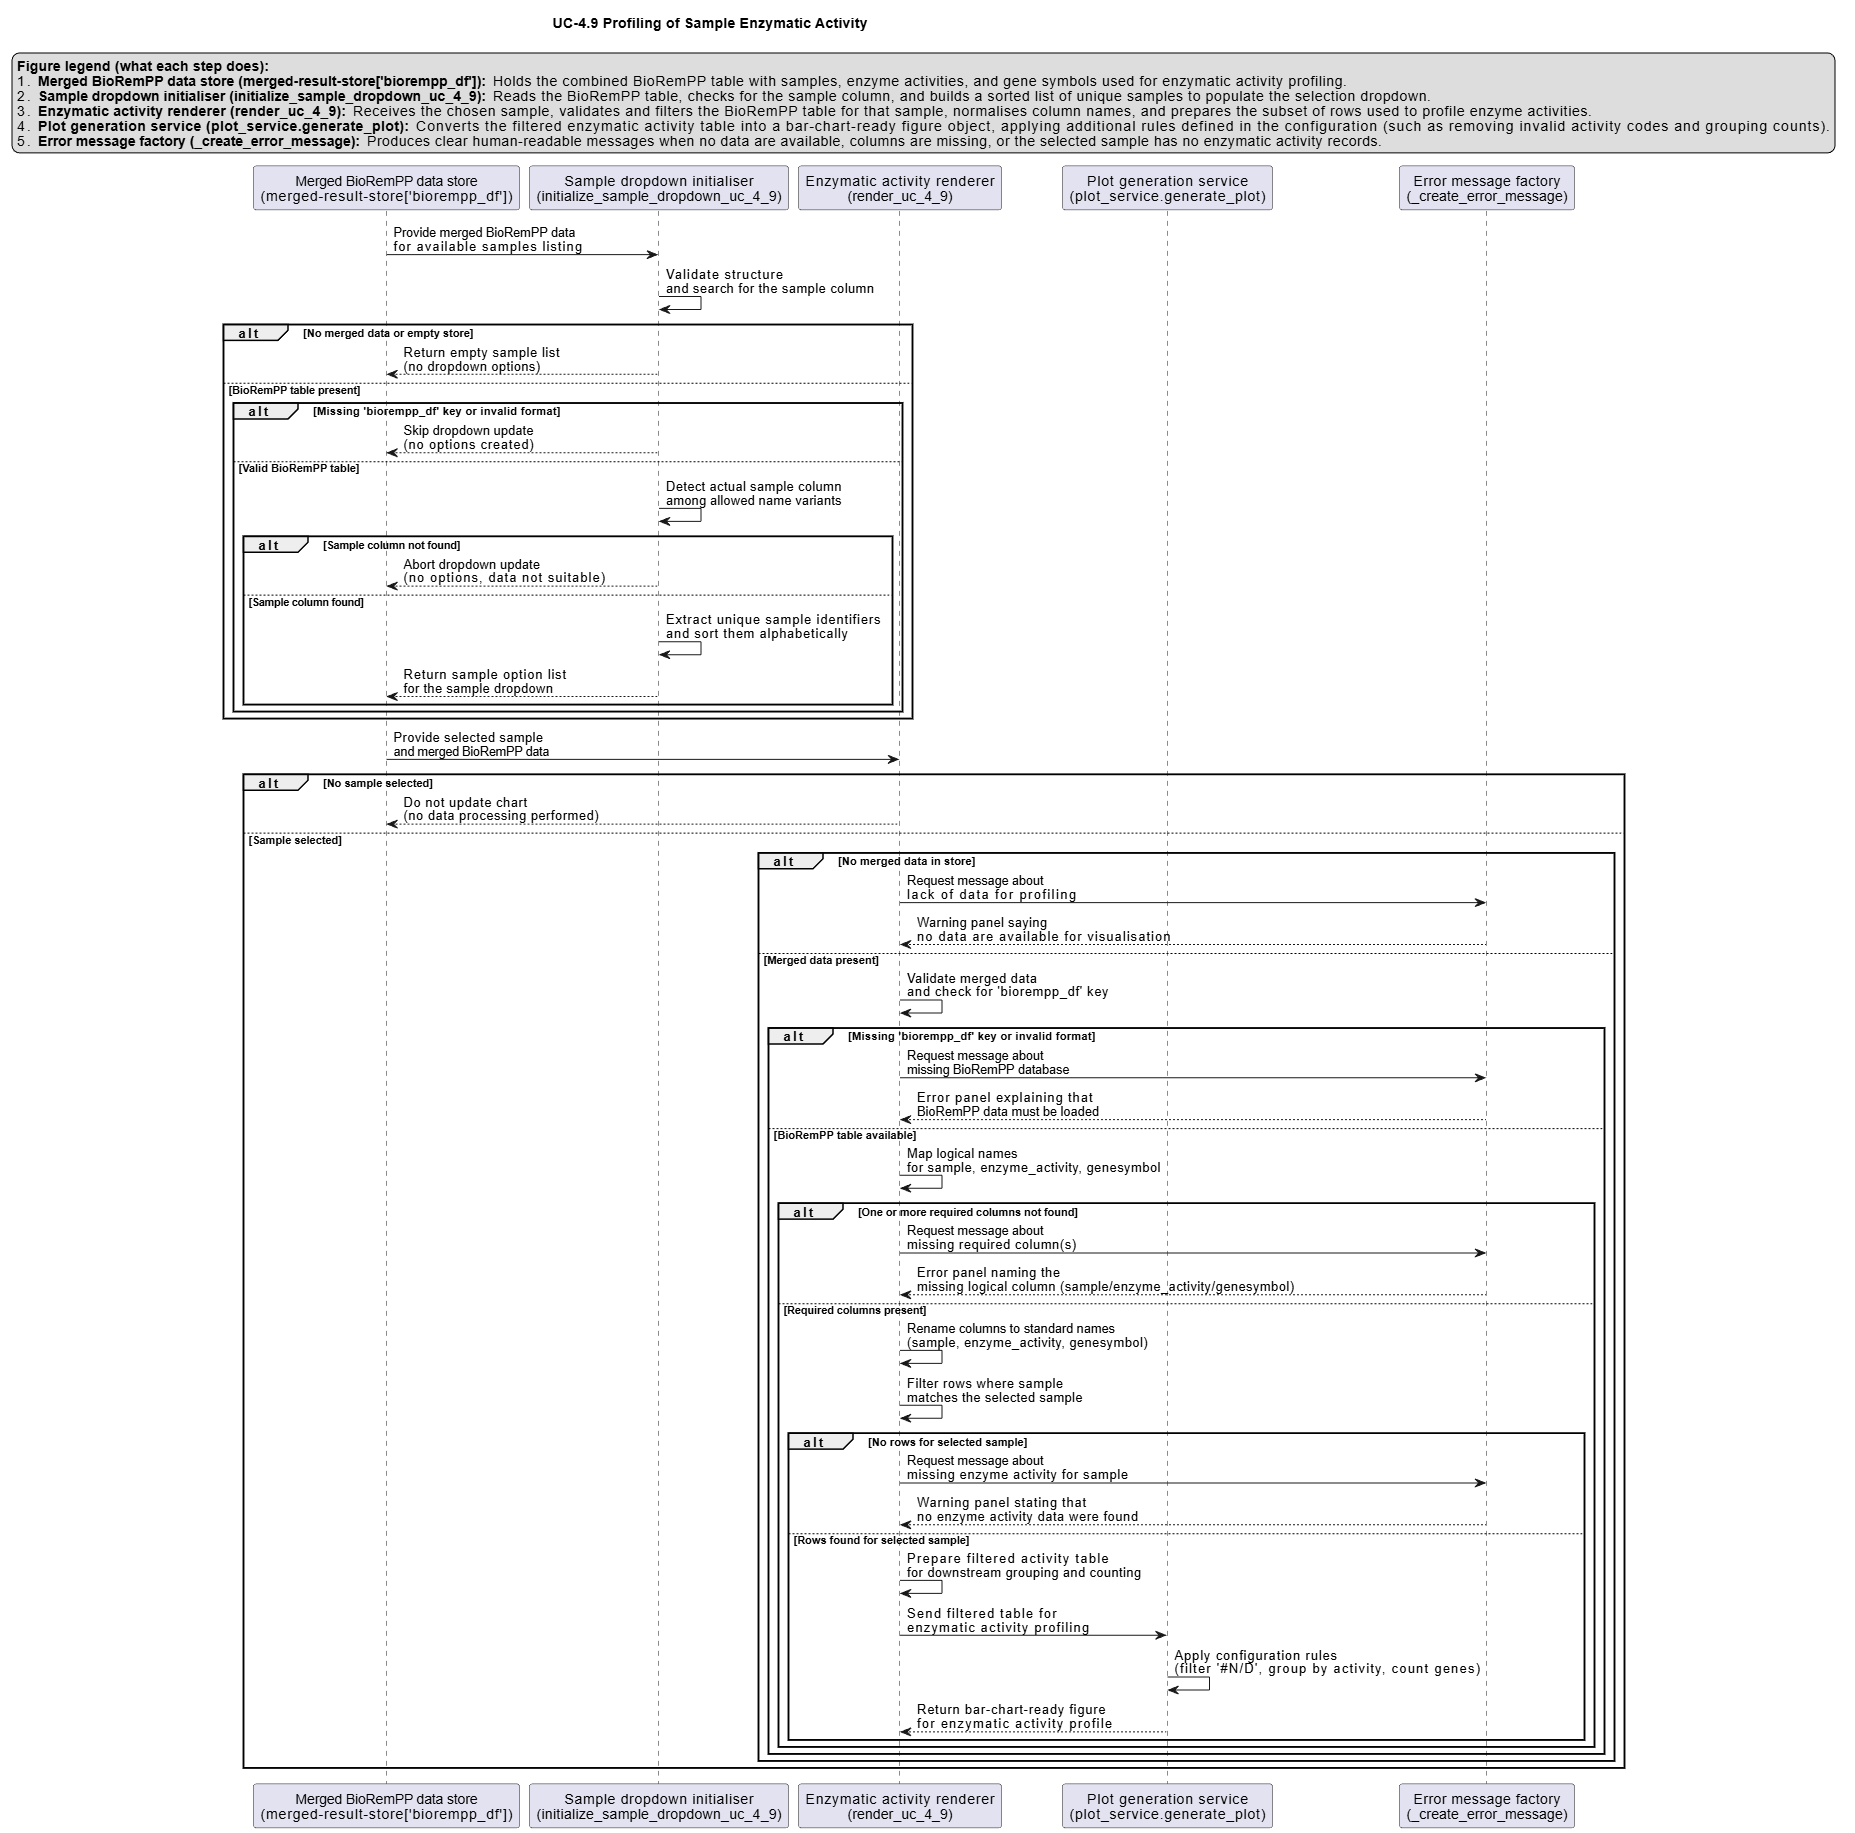
UC-4.9 — Profiling of Sample Enzymatic Activity
Module: 4 – Functional and Genetic Profiling
Visualization type: Interactive bar chart (enzyme activity vs. gene diversity)
Primary inputs: BioRemPP_Results.xlsx or BioRemPP_Results.csv (sample–enzyme–gene associations)
Primary outputs: Ranked enzymatic activity profile per sample
Scientific Question and Rationale
Question: For any given sample, which enzymatic functions are most broadly represented, as measured by the diversity of unique gene annotations associated with them?
The same high-level enzymatic activity (e.g., oxidoreductase, hydrolase) can be annotated across many distinct genes. Quantifying how many unique gene annotations are associated with each enzymatic function can reveal:
- which activities have the broadest gene annotation coverage for that sample, and
- which annotated functions are most represented in the dataset for that sample.
Data and Inputs
-
Primary data source:
BioRemPP_Results.xlsx or BioRemPP_Results.csv(semicolon-delimited) -
Key columns:
sample– identifier for each biological sampleenzyme_activity– functional label for enzymatic activity (e.g., oxidoreductase, transferase)-
genesymbol– gene symbols mapped to that enzymatic activity in a given sample -
User control:
-
Dropdown – Sample: all unique
sampleidentifiers available in the dataset. -
Output structure:
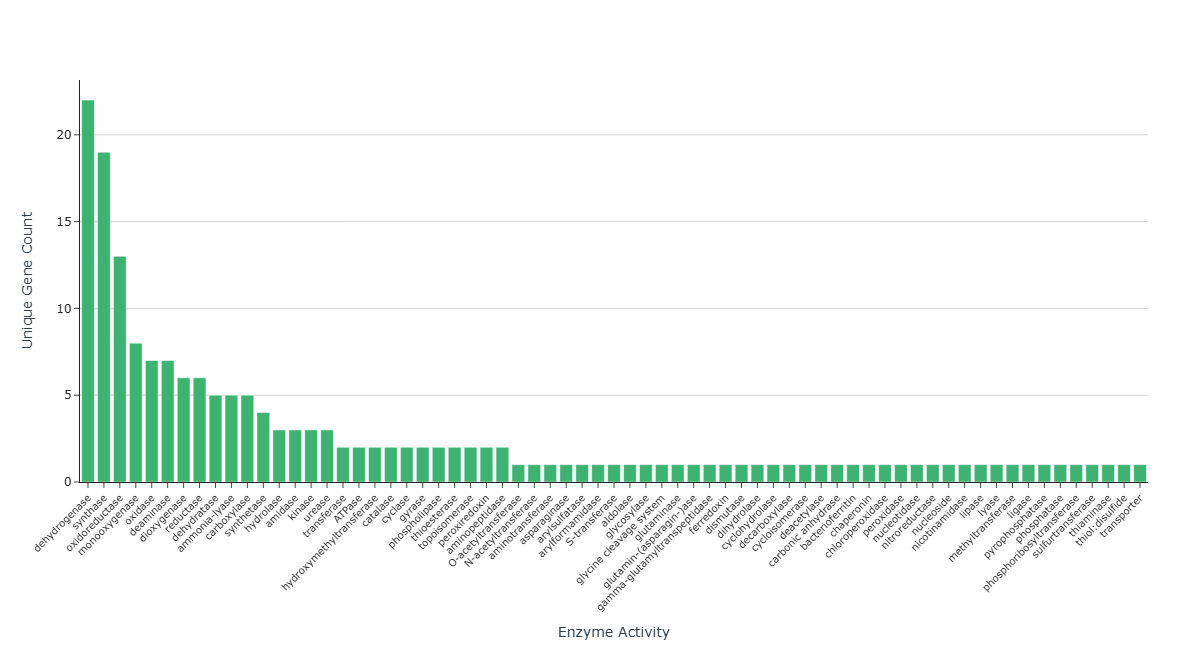
- X-axis: enzymatic activities (
enzyme_activity) - Y-axis: number of distinct
genesymbolvalues per activity for the selected sample - Bars: one bar per enzymatic activity, ranked by gene diversity
Analytical Workflow
- User Selection
- The user selects a sample from the interactive dropdown menu.
-
This choice defines the focal organism or consortium for profiling.
-
Dynamic Filtering
- The
BioRemPP_Results.xlsx or BioRemPP_Results.csvtable is filtered to retain only rows matching the selectedsample. -
Rows with missing
enzyme_activityorgenesymbolare discarded to ensure valid associations. -
Aggregation
- The filtered data is grouped by
enzyme_activity. - For each enzymatic activity, the number of distinct gene symbols is computed (e.g., using
nunique()ongenesymbol). -
The result is a summary table:
- one row per
enzyme_activity, - one value:
unique_gene_count.
- one row per
-
Sorting and Rendering
- Enzymatic activities are sorted in descending order of
unique_gene_count. - A bar chart is rendered:
- X-axis:
enzyme_activity, - Y-axis:
unique_gene_count, - bars labelled with their exact counts for clarity.
- X-axis:
How to Read the Plot
- Dropdown Menu – Sample Selection
- Choose a Sample to analyze.
-
The bar chart updates to show the enzymatic activity profile for that specific sample.
-
X-axis – Enzymatic Activities
- Each tick corresponds to a distinct
enzyme_activityannotated in the selected sample. -
Examples might include hydrolase, monooxygenase, transferase, oxidoreductase, etc.
-
Y-axis – Gene Diversity per Activity
-
The vertical value for each bar is the count of unique genes (
genesymbol) mapped to that activity in the chosen sample. -
Bars – Genetic Support for Each Activity
- The height and numeric label of each bar indicate how many distinct genes support that activity.
- Taller bars represent enzymatic functions backed by a more diverse gene set.
Representative Output
The image below illustrates a representative output generated by this use case using the example dataset.
Click on the image to enlarge and explore details.
Interpretation and Key Messages
- Enzymatic Functions with High Gene Annotation Diversity
-
Enzymatic activities with tall bars may represent functions annotated across many distinct genes in that sample:
- a large number of gene annotations are linked to that activity in the dataset.
-
Concentrated vs. Distributed Annotation Profiles
-
A profile dominated by a small set of activities (e.g., many genes annotated as oxidoreductase or monooxygenase) may indicate concentrated annotation coverage in those functional categories.
-
Breadth vs. Depth of Gene Annotations
- A wide spread of activities with moderate gene counts may suggest broad annotation coverage across many enzymatic functions.
-
A few activities with very high gene counts may indicate concentrated annotation depth in those specific functional categories.
-
Comparative Profiling Across Samples
- By switching the selected sample:
- one can compare which activities have the most gene annotations across different samples,
- identify samples with different annotation profiles (e.g., one with many hydrolase annotations, another with many monooxygenase annotations), and
- generate annotation-based hypotheses for experimental follow-up.
Reproducibility and Assumptions
- Input Format
The analysis requires a semicolon-delimited table with at least: sample,enzyme_activity,-
genesymbol. -
Presence and Counting Rules
- Each bar's value is the number of unique gene symbols associated with that activity for the selected sample.
-
Multiple occurrences of the same
(sample, enzyme_activity, genesymbol)combination do not increase the count; they are treated as a single gene providing that activity. -
Scope and Limitations
- The chart reflects annotated gene diversity per enzymatic function, not measured expression or activity levels.
enzyme_activitylabels depend on upstream annotation pipelines; misannotations or incomplete mappings will affect the profile.
Activity diagram of the use case
Click on the image to enlarge and explore details.