UC-5.1 — Sample-Compound Class Interaction
Module: 5 – Modeling Interactions of Samples, Genes, and Compounds
Visualization type: Chord diagram (bipartite sample–compound-class interaction network)
Primary inputs: BioRemPP results table with sample and compoundclass columns
Primary outputs: Interaction matrix of samples × compound classes (co-occurrence counts)
Scientific Question and Rationale
Question: Which samples are most co-annotated with which chemical classes, and what might this reveal about their annotation coverage patterns?
This use case maps the co-annotation frequency between each biological sample and the different classes of chemical compounds. By summarizing how often each sample is co-annotated with each compound class, and visualizing these relationships as a chord diagram, the analysis can provide an intuitive, systems-level overview of the co-annotation landscape. It may highlight samples with broad compound class coverage and those with narrowly focused co-annotation patterns.
Data and Inputs
- Primary data source:
BioRemPP_Results.xlsx or BioRemPP_Results.csv - Key columns:
sample– identifier for each biological samplecompoundclass– categorical label for the chemical class of each compound- Accepted format: semicolon-delimited text table (
.txtor.csv) - Derived structure: interaction matrix with:
- rows = samples
- columns = compound classes
- cell = interaction count for each sample–class pair
Analytical Workflow
-
Data Loading
The primary results table (BioRemPP_Results.xlsx or BioRemPP_Results.csv) is loaded from its semicolon-delimited format. -
Filtering
The dataset is filtered to retain only complete entries containing both a validsampleand acompoundclass. Rows with missing values in either field are removed. -
Aggregation (Interaction Strength)
The filtered data is grouped by each unique(sample, compoundclass)pair. - For each pair, the total number of co-occurrences (rows) is counted.
-
This count serves as the interaction strength between that sample and that compound class.
-
Chord Matrix Construction
The aggregated counts are arranged into a matrix or edge list suitable for chord diagram rendering, where: - each sample is treated as a source node,
- each compound class is treated as a target node, and
-
the edge weight is the interaction count.
-
Rendering
A chord diagram is generated: - arcs on the circumference represent samples and compound classes,
- ribbons (chords) connect each sample to the classes with which it interacts,
- chord thickness encodes interaction strength.
How to Read the Plot
- Outer Arcs (Nodes)
Each colored arc along the circle represents either: - a Sample, or
-
a Compound Class.
The length of an arc is proportional to the total number of interactions (sum of counts) associated with that entity. -
Chords (Ribbons)
The ribbons spanning between arcs represent individual Sample–Compound Class interactions: - one end of the ribbon is anchored at a sample arc,
-
the other end at a compound class arc.
-
Chord Thickness
The thickness of a chord at its connection points is proportional to the interaction count for that sample–class pair: - thicker chords indicate stronger associations (more co-occurrences),
- thinner chords indicate weaker or less frequent associations.
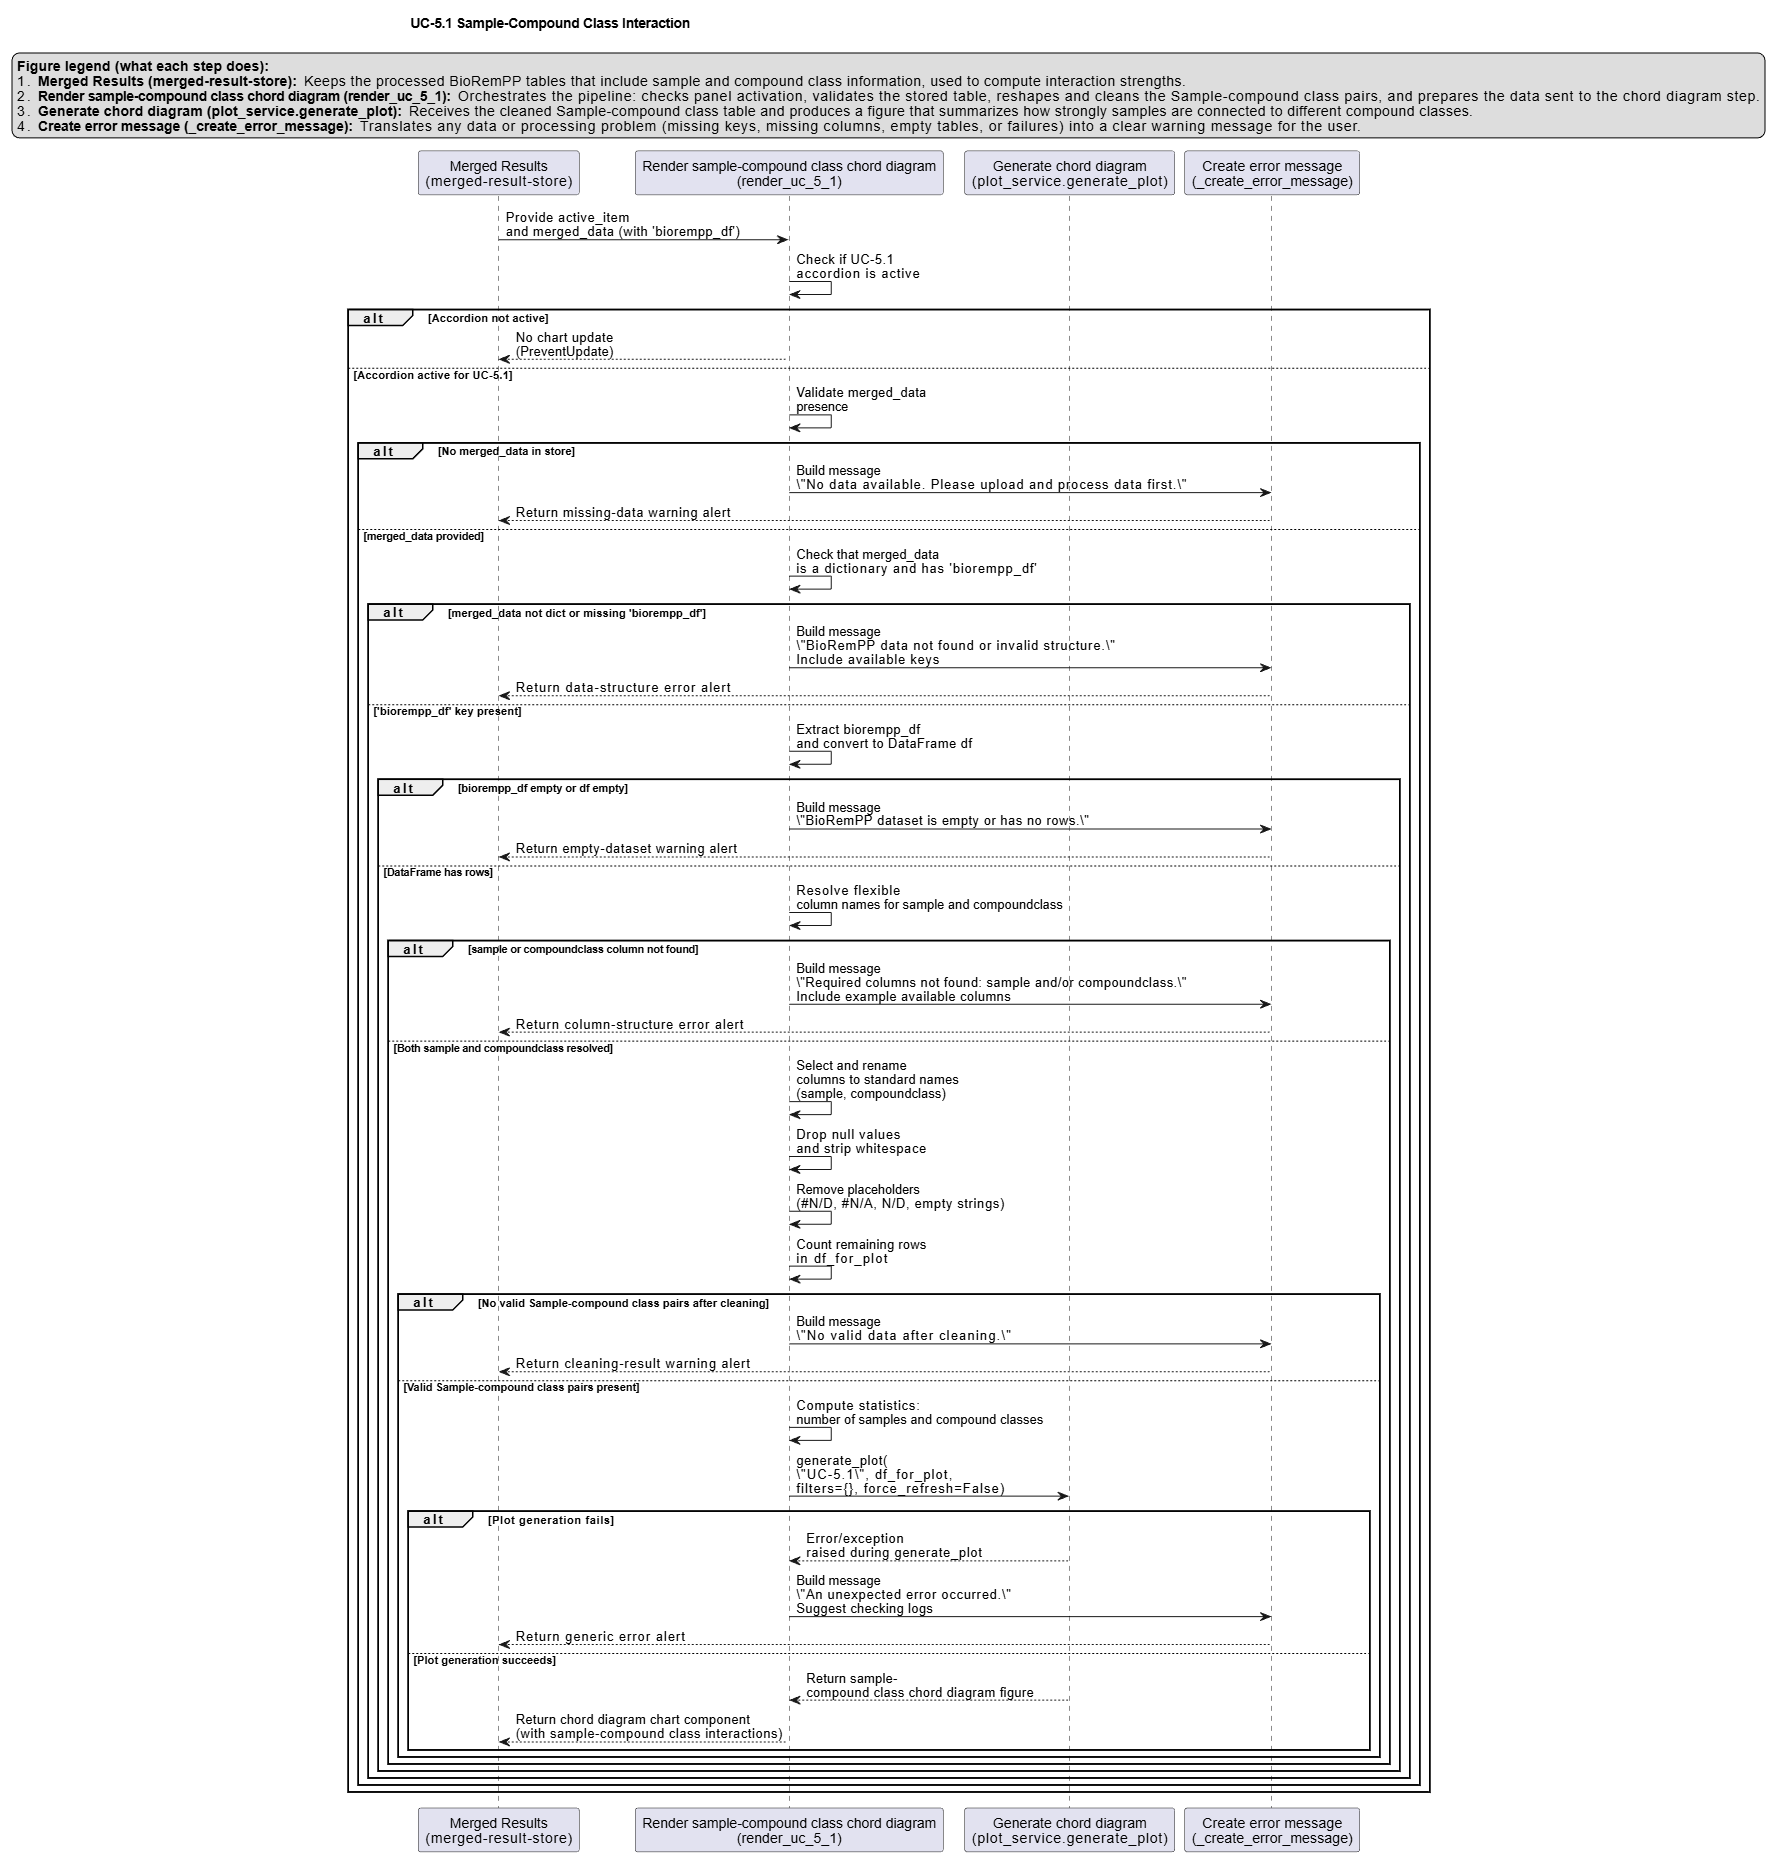
Representative Output
The image below illustrates a representative output generated by this use case using the example dataset.
Click on the image to enlarge and explore details.
Interpretation and Key Messages
- Strong Co-annotation Associations A thick chord between a specific sample and a given compound class may indicate a strong co-annotation frequency:
- the sample is co-annotated with many compounds from that class in the database,
-
which may suggest a concentrated annotation profile for that chemical domain, warranting further investigation.
-
Broad vs. Narrow Annotation Profiles
- A sample with multiple substantial chords connecting to several compound classes shows broad compound class co-annotation coverage across diverse chemical spaces.
-
A sample whose representation is dominated by one or a few very thick chords shows narrower co-annotation coverage concentrated in specific chemical classes.
-
Highly Co-annotated Chemical Classes Compound classes that receive many thick chords from multiple samples may emerge as:
- widely co-annotated classes in the dataset, and
-
potential focal points for further investigation, as they are broadly represented across the available samples.
-
Co-annotation Landscape Overview The overall pattern of chords can provide a global view of how co-annotations are distributed:
- identifying central samples and classes that structure the network,
- potentially revealing imbalances, redundancies, or gaps in annotation coverage.
Reproducibility and Assumptions
-
Input Format
The analysis assumes a semicolon-delimited table containing at least the columnssampleandcompoundclass. -
Interaction Definition
Interaction strength is defined as the total number of co-occurrence records for each(sample, compoundclass)pair in the raw table: - multiple entries for the same pair (e.g., different compounds within the same class, or multiple genes linked to that class) increase the aggregate count,
-
the chord diagram thus reflects overall interaction intensity rather than unique compound counts.
-
Scope of Interpretation The chord diagram summarizes co-annotation frequency, not mechanistic detail:
- it does not directly encode pathway completeness, kinetic efficiency, or regulatory control,
- but it can provide a high-level annotation map that may guide more detailed, pathway-focused or gene-level analyses in subsequent use cases.
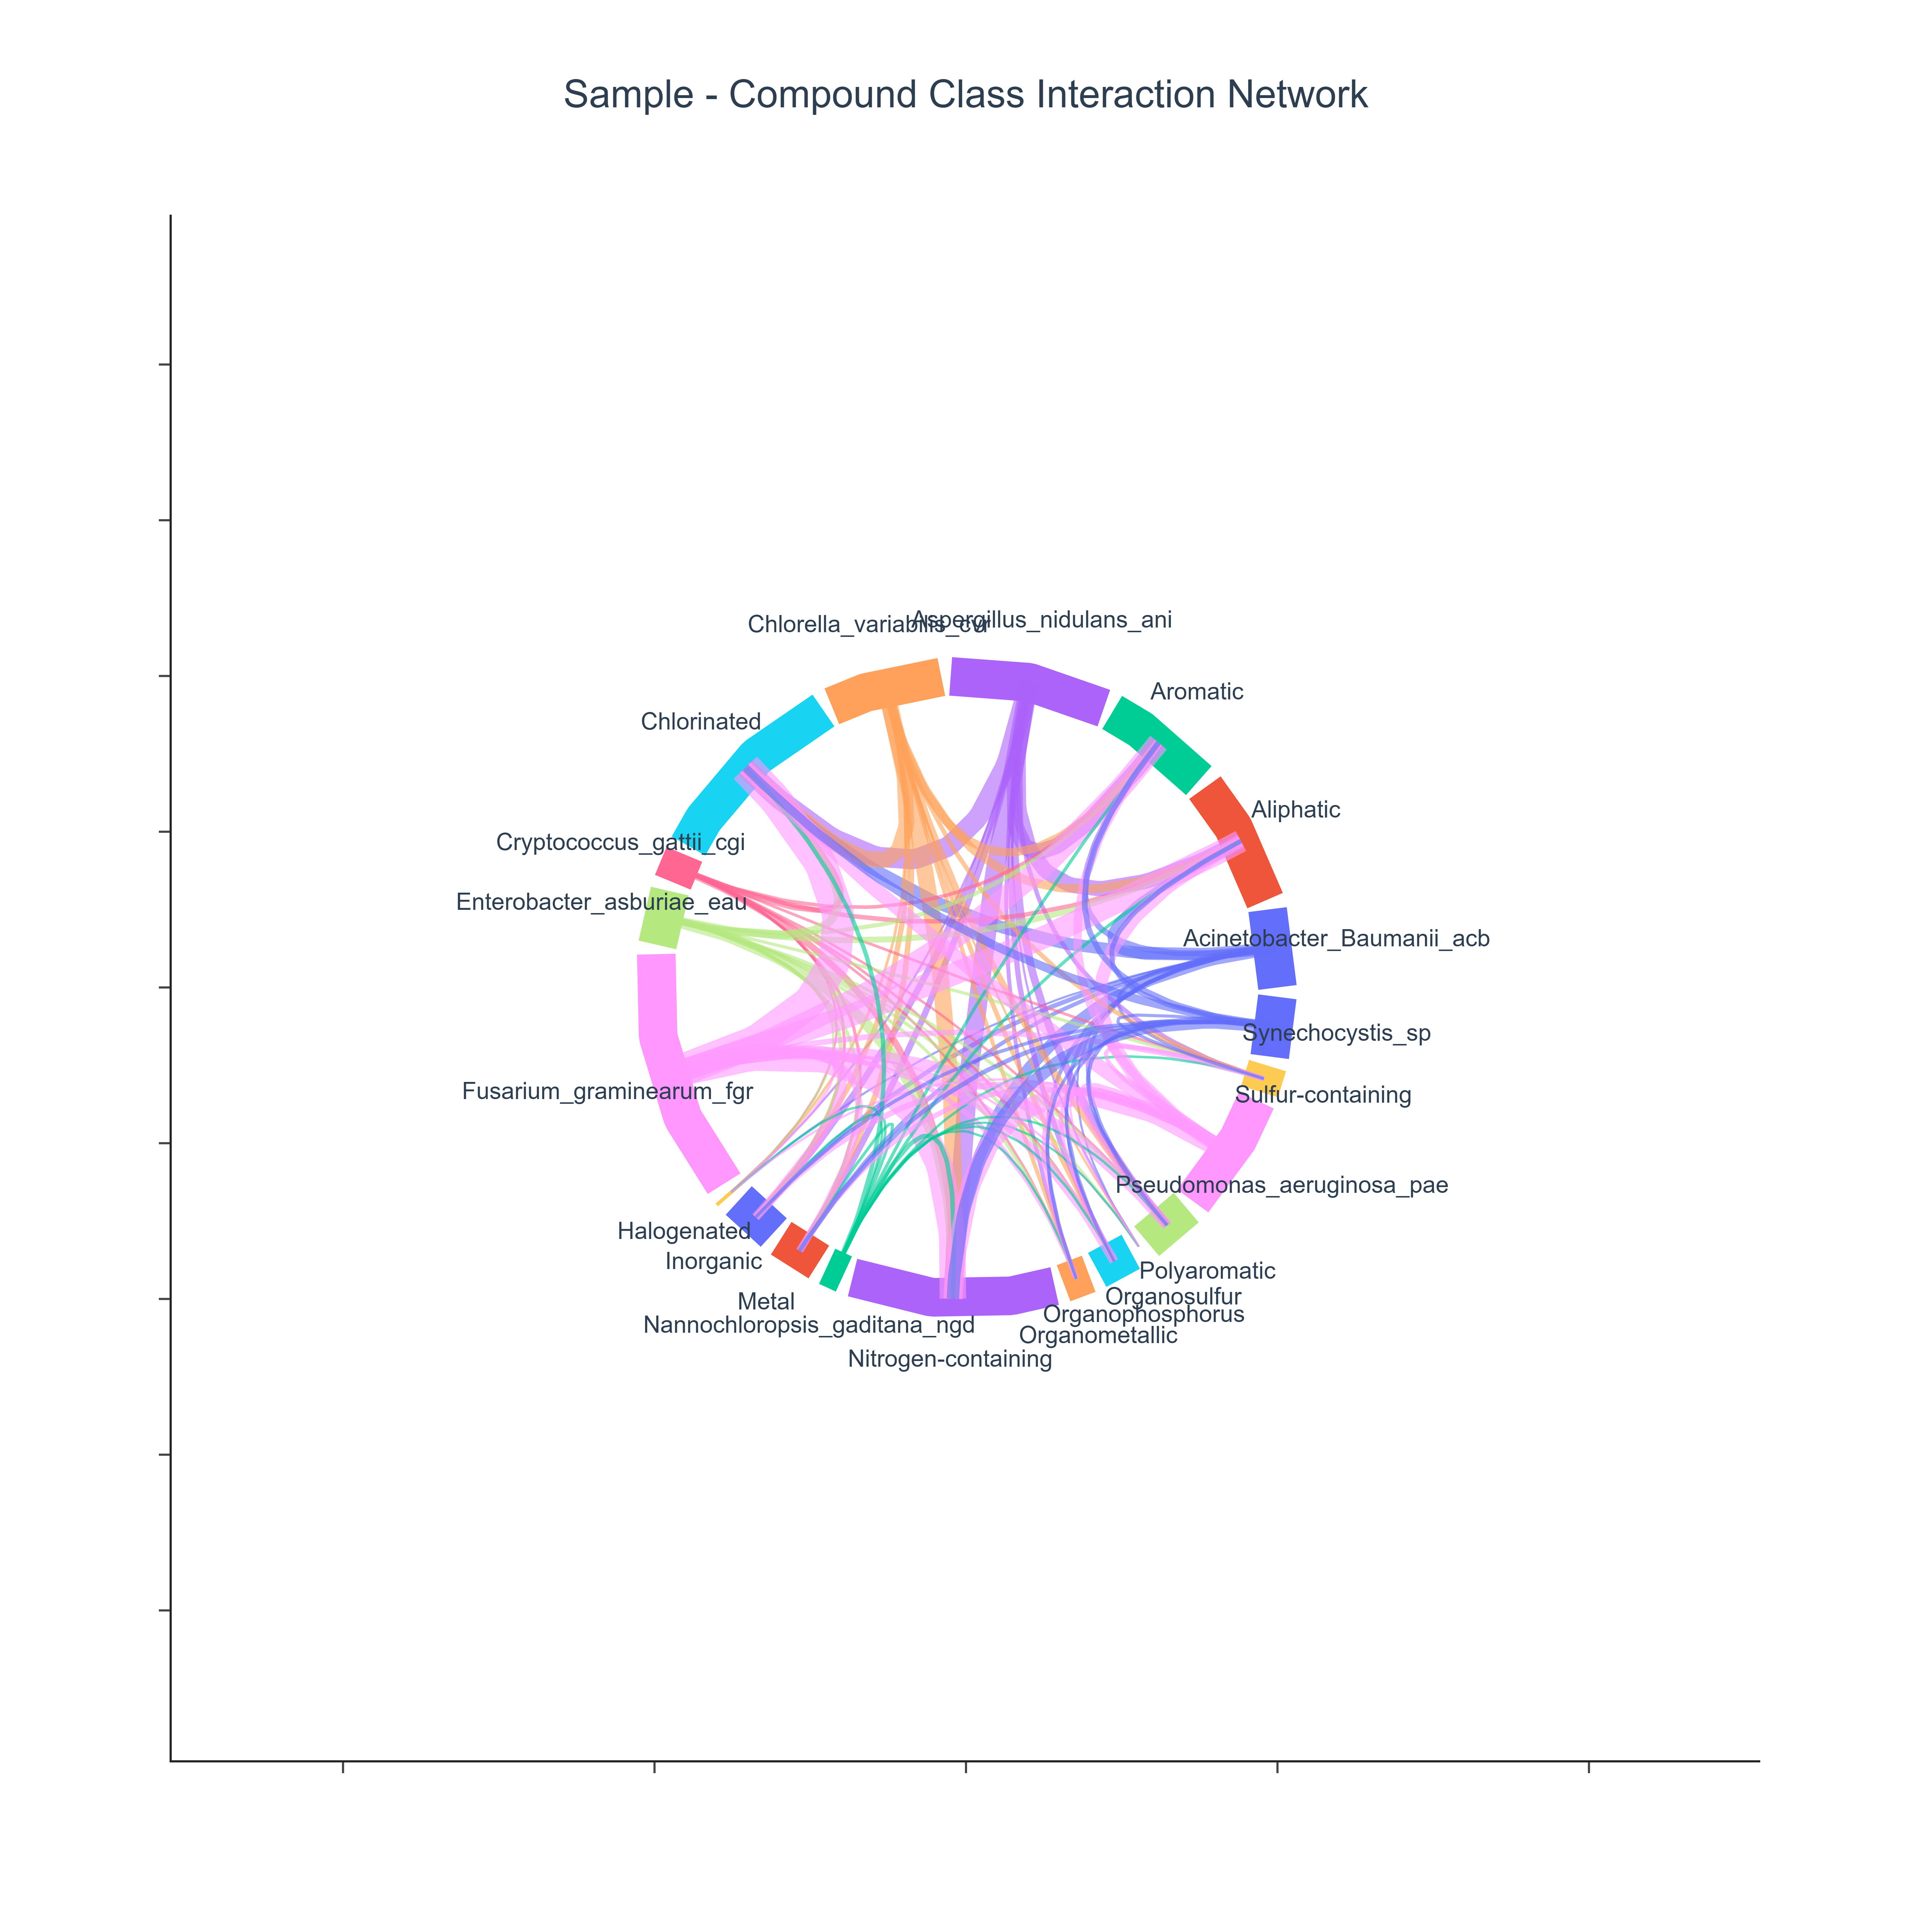
Activity diagram of the use case
Click on the image to enlarge and explore details.