UC-7.1 — Predicted Compound Toxicity Profiles
Module: 7 – Toxicological Risk Assessment and Profiling
Visualization type: Faceted heatmap (compound × toxicological endpoints, grouped by super-category)
Primary inputs: ToxCSM results table (ToxCSM.xlsx or ToxCSM.csv) with paired value_ and label_ columns
Primary outputs: Per-compound toxicity "fingerprints" across multiple endpoints and super-categories
Scientific Question and Rationale
Question: What is the comprehensive toxicological profile of each chemical compound across a wide range of risk categories, and which compounds pose the most significant and multi-endpoint hazards?
This use case provides a detailed toxicological fingerprint for each compound analyzed by the ToxCSM model. Rather than focusing on a single endpoint, the faceted heatmap integrates predictions across numerous toxicological endpoints, which are grouped into five major super-categories. This design can enable a direct, compound-centric comparison of specific risk patterns, potentially highlighting substances that are predicted as hazardous in multiple dimensions (e.g., genomic, environmental, organic) and therefore particularly relevant for prioritization in downstream risk-aware analyses.
Data and Inputs
- Primary data source:
ToxCSM.xlsx or ToxCSM.csv(semicolon-delimited) - Key columns:
compoundname– name of the chemical compoundvalue_*– numerical toxicity scores predicted by ToxCSM (e.g.,value_Gen_Carcinogenesis)label_*– qualitative categories corresponding to each score (e.g., "High", "Low", "Non-toxic")- Derived fields:
endpoint– specific toxicological endpoint (e.g.,Gen_Carcinogenesis)supercategory– grouped toxicity domain (e.g.,Genomic)- Toxicity super-categories:
- Nuclear Response
- Stress Response
- Genomic
- Environmental
- Organic
Analytical Workflow
-
Data Loading
The raw ToxCSM results table (ToxCSM.xlsx or ToxCSM.csv) is loaded from its semicolon-delimited format. -
Data Transformation (Pivoting to Long Format)
The wide-format input, containing multiplevalue_andlabel_columns, is reshaped into a long, tidy format. In the processed table: - each row corresponds to a single
(compoundname, endpoint)pair, -
with associated numeric toxicity score and qualitative label.
-
Endpoint Categorization
Each specific endpoint (e.g.,Gen_Carcinogenesis,Env_Toxicity) is mapped to one of the five broader toxicological super-categories (e.g.,Genomic,Environmental). This mapping is stored in a lookup structure and applied to all rows. -
Aggregation of Duplicate Entries
When multiple raw entries exist for the same(compoundname, endpoint)pair (e.g., due to different runs or conditions), the data is: -
grouped by
compoundnameandendpoint(and/orsupercategory) -
Rendering
The aggregated data is rendered as faceted heatmaps: - one facet (subplot) per super-category,
- within each facet, rows represent Compounds and columns represent Endpoints belonging to that super-category,
- cell color intensity encodes the averaged numeric toxicity score.
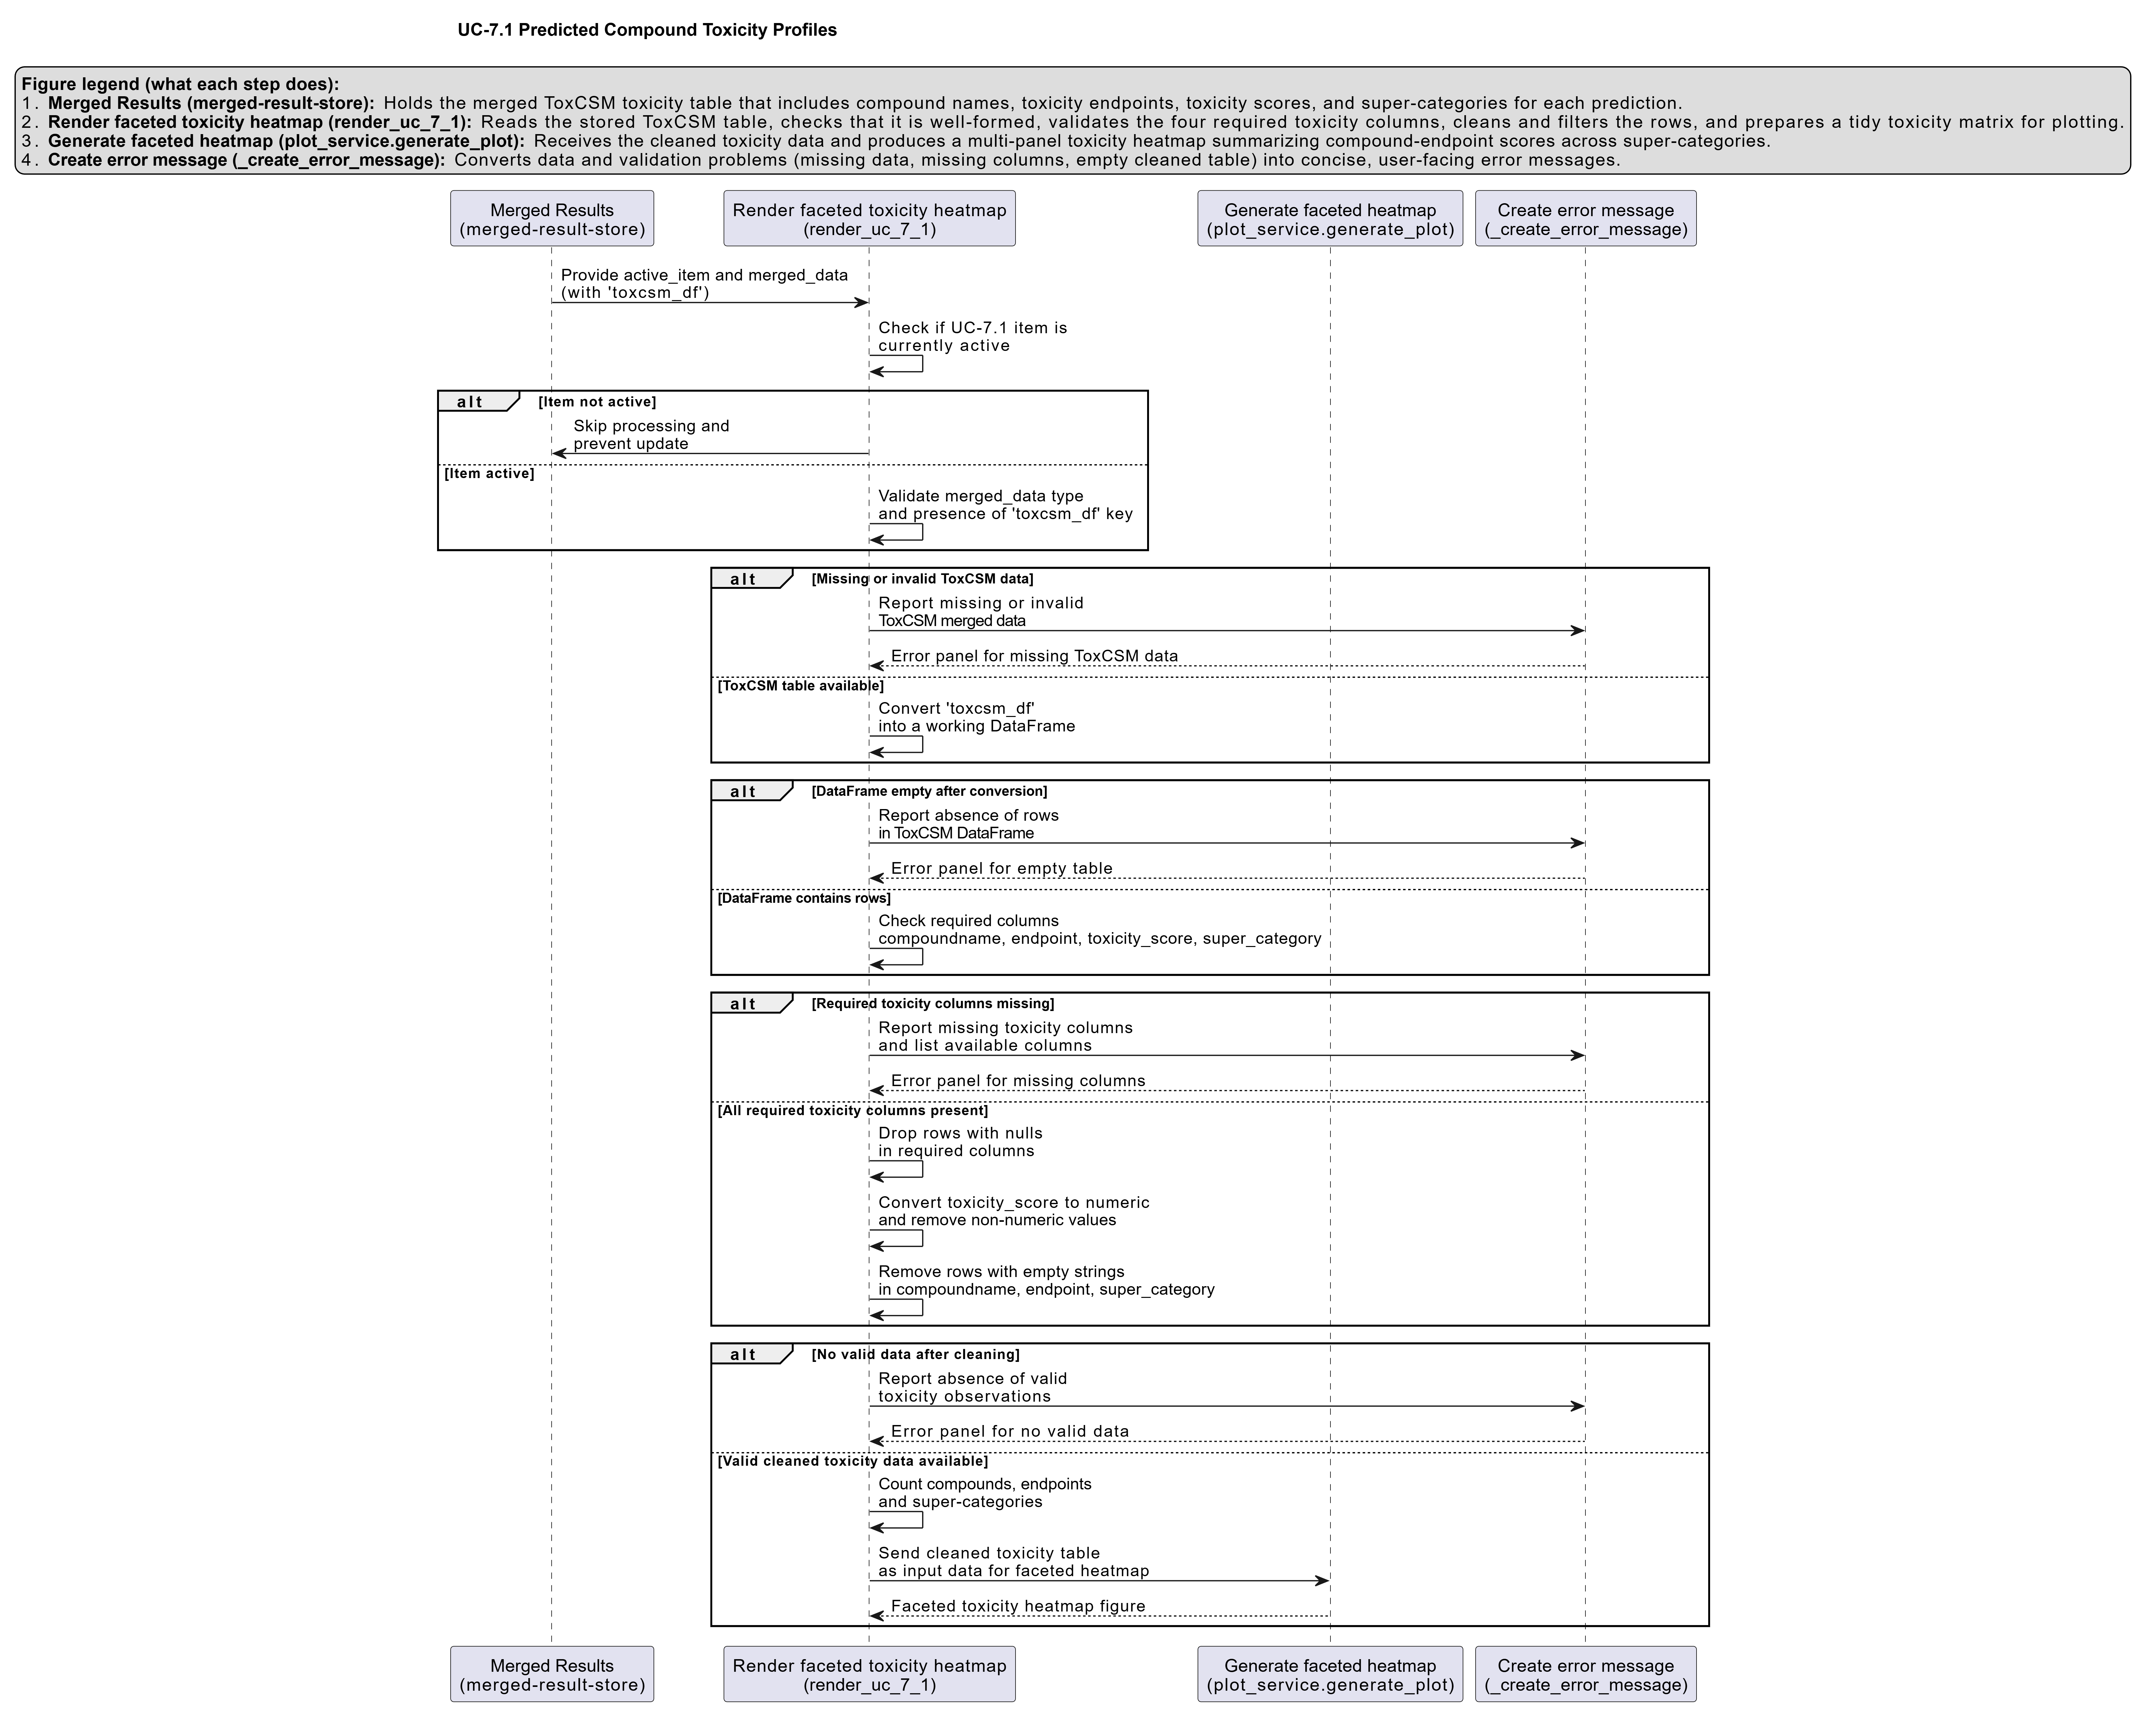
How to Read the Plot
-
Facets (Subplots)
Each of the five subplots represents a major Toxicity Super-category: Nuclear Response, Stress Response, Genomic, Environmental, or Organic. -
Y-axis (Rows)
Represents individual Compounds (compoundname). -
X-axis (Columns)
Represents specific Toxicological Endpoints within the corresponding super-category. -
Cell Color
The color intensity of each cell indicates the predicted toxicity score (typically on a 0–1 scale or analogous normalized range). - Darker or warmer colors (e.g., reds) indicate higher predicted risk,
-
lighter colors indicate lower predicted risk.
-
Hover Information (Interactive Mode)
Hovering over a cell reveals: - the compound name,
- the specific endpoint,
- the numerical toxicity score, and
- its qualitative label (e.g., "High Toxicity", "Low Toxicity").
Representative Output
The image below illustrates a representative output generated by this use case using the example dataset.
Click on the image to enlarge and explore details.
Interpretation and Key Messages
-
Compound Risk Fingerprint
Reading across a row can provide a comprehensive toxicological "fingerprint" for a single compound. This may facilitate identification of compounds that pose multi-faceted hazards, such as those predicted to be both carcinogenic and environmentally toxic. -
High-Concern Endpoints Columns that are consistently dark across many compounds within a facet may indicate endpoints that are frequently predicted as high-risk for the chemicals in this dataset. These endpoints could represent dimensions requiring particular attention in risk management and further experimental investigation.
-
Prioritizing "Problem" Compounds Compounds with numerous high-intensity cells (especially spanning multiple facets) might be considered high-priority candidates for further investigation, as they are predicted to be hazardous across several biological and environmental dimensions. These compounds may warrant targeted annotation analysis in subsequent modules and experimental follow-up.
-
Comparative Risk Profiling
By comparing patterns across rows and facets, users may distinguish: - compounds that are broadly toxic across many domains,
- compounds with localized risk profiles (e.g., primarily genomic or primarily environmental), and
- compounds with relatively benign predictions.
Reproducibility and Assumptions
-
Input Format
The workflow assumes a semicolon-delimitedToxCSM.xlsx or ToxCSM.csvtable containing pairedvalue_*(numeric) andlabel_*(qualitative) columns for each endpoint. -
Endpoint–Category Mapping
The assignment of endpoints to the five super-categories is based on a predefined mapping. Any changes to this mapping will alter which endpoints appear in each facet but not the underlying scores. -
Model Dependency
All toxicity scores originate from the ToxCSM predictive model. The visualization assumes that the model's output is internally calibrated and comparable across endpoints, but it does not account for experimental validation, dose–response relationships, or exposure scenarios, which must be evaluated separately.
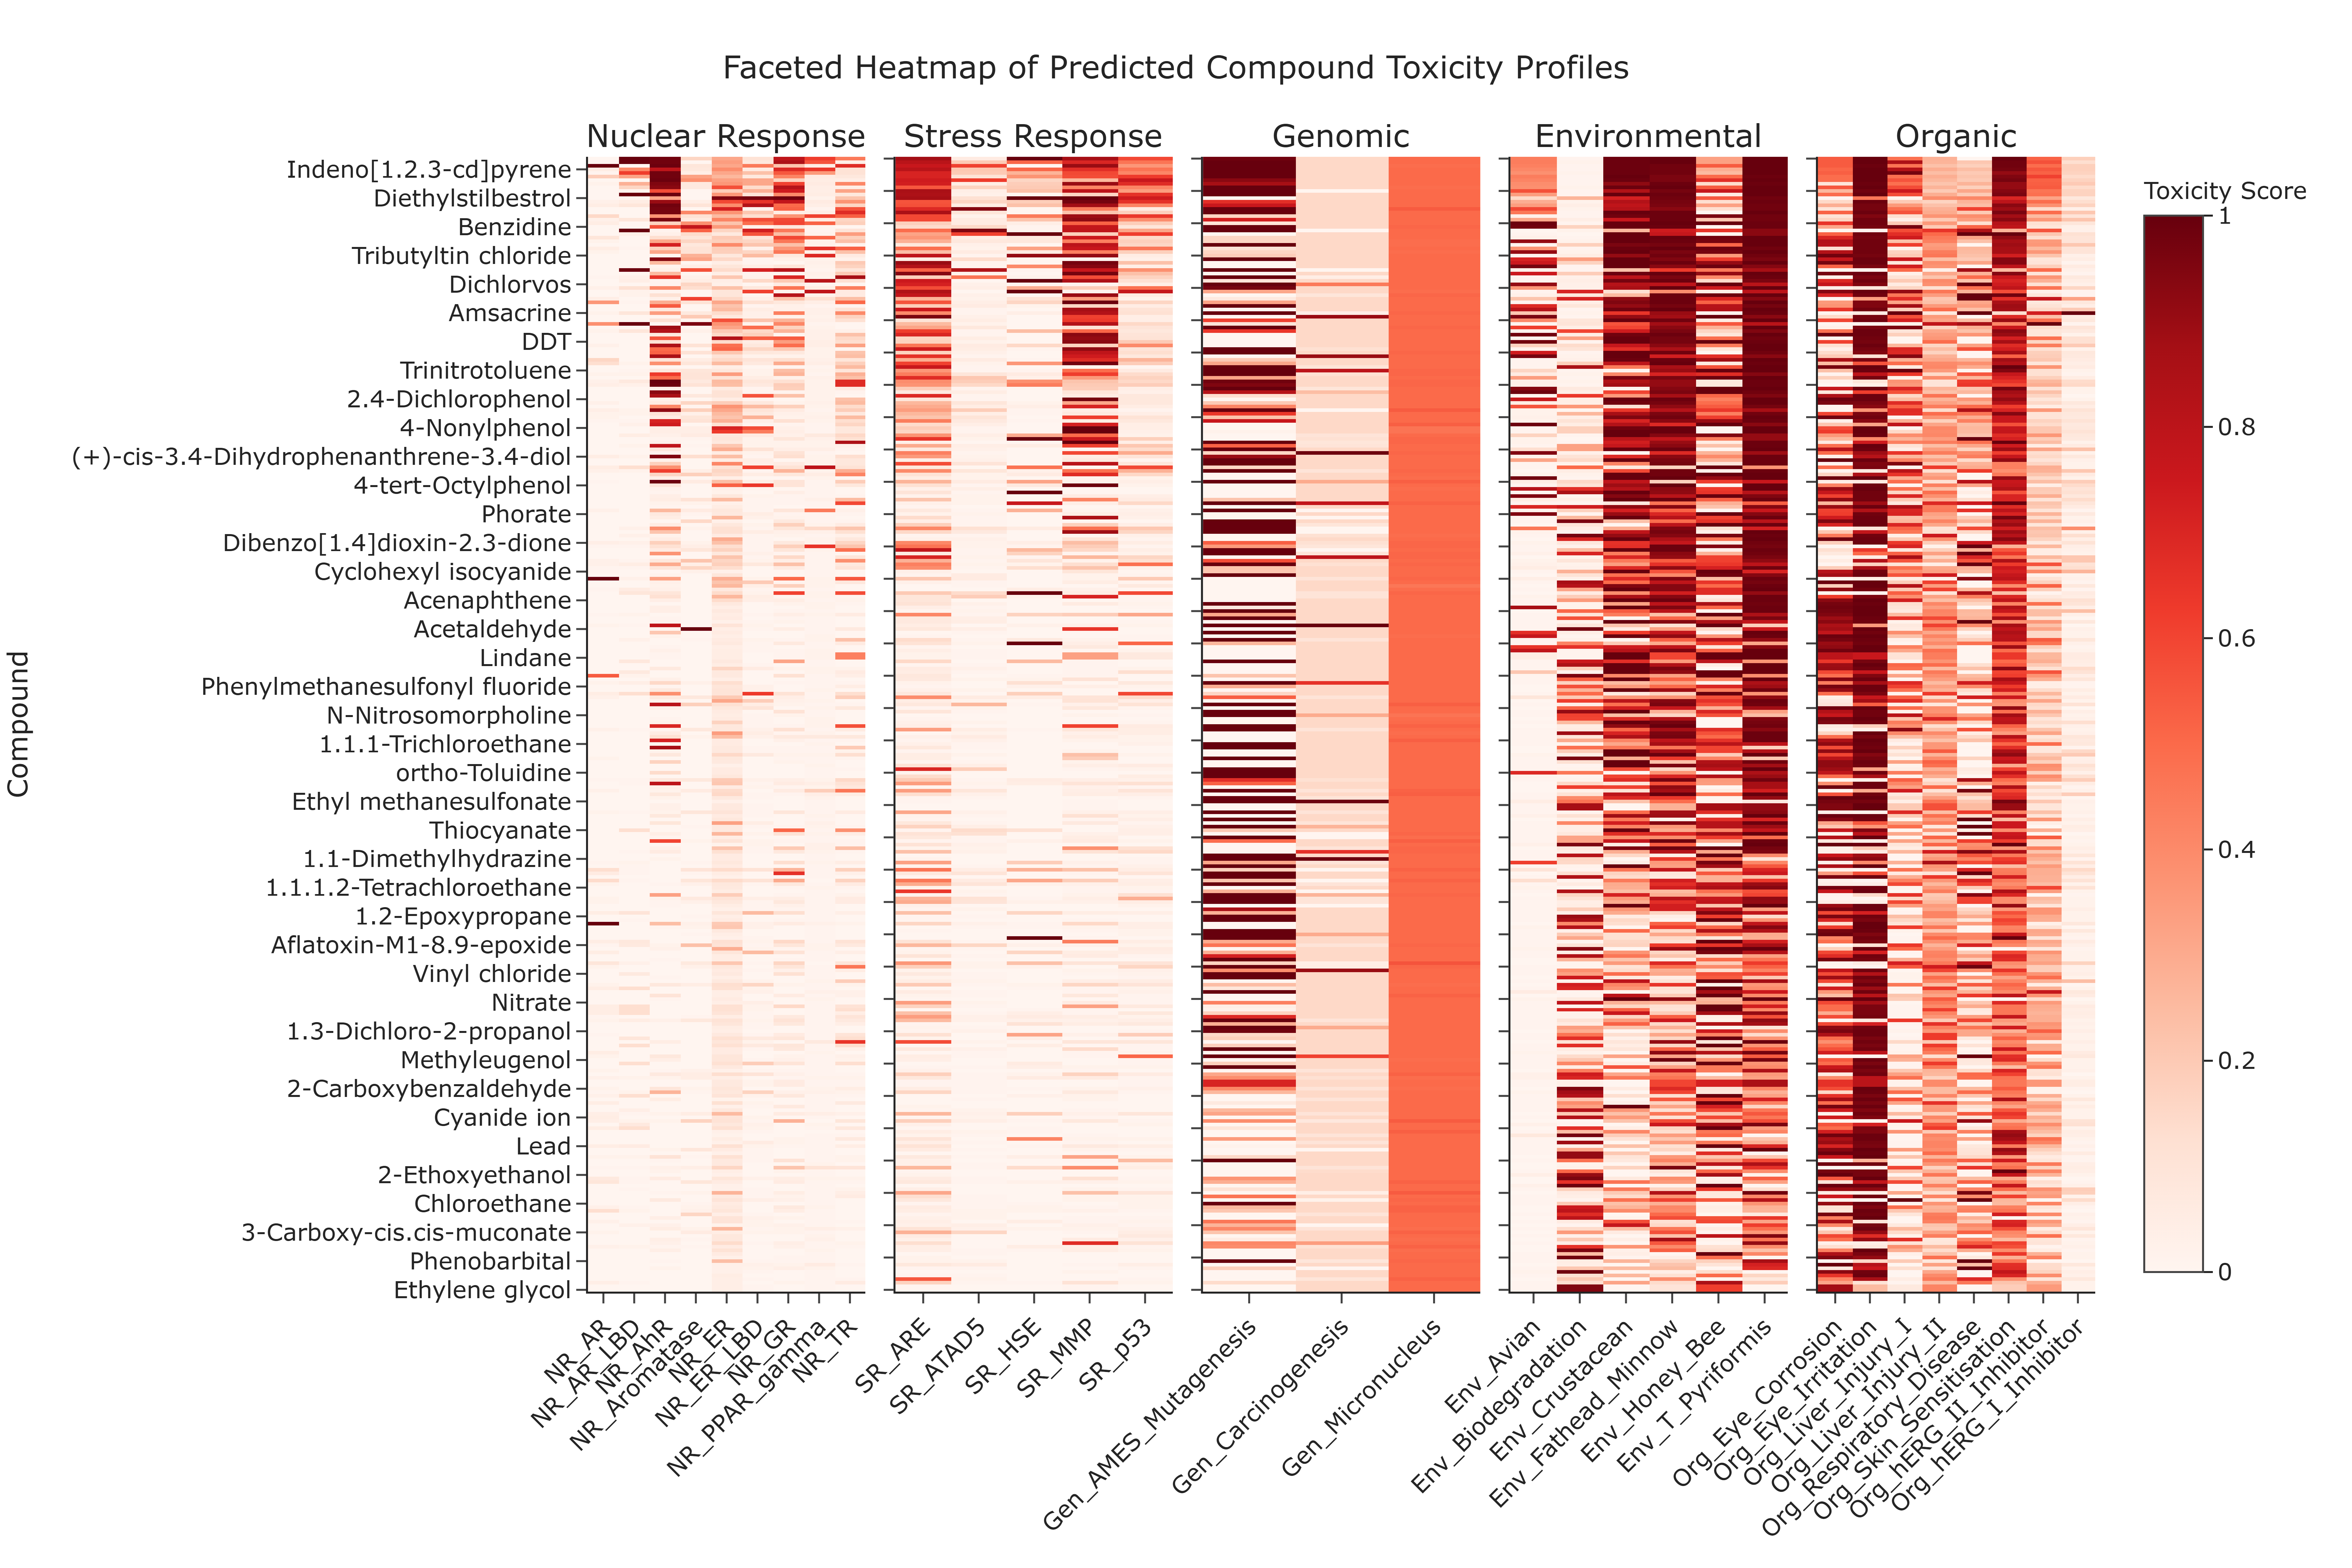
Activity diagram of the use case
Click on the image to enlarge and explore details.