UC-7.2 — Concordance Between Predicted Risk and Regulatory Scope
Module: 7 – Toxicological Risk Assessment and Profiling
Figure: (chord diagram: regulatory agencies × high predicted risk compounds)
Visualization type: Chord diagram (overlap between regulatory compound lists and high-risk predictions)
Primary inputs: BioRemPP_Results.xlsx or BioRemPP_Results.csv (regulatory annotation) and ToxCSM.xlsx or ToxCSM.csv (predicted toxicity labels)
Primary outputs: Pairwise overlap (shared compound counts) between regulatory agencies and the "High Predicted Risk" set
Scientific Question and Rationale
Question: What is the structure and magnitude of the overlap between compounds monitored by regulatory agencies and those predicted to be of high toxicological risk?
This use case quantifies the concordance between compounds flagged as high-risk by the ToxCSM model and those listed by different environmental regulatory agencies. The chord diagram can provide an intuitive, system-level view of how well current regulatory priorities align with model-based toxicity predictions. By visualizing shared compounds as connections between nodes, the analysis may highlight both areas of strong agreement and potential gaps, where predicted high-risk compounds may not yet be prominently represented in regulatory frameworks.
Data and Inputs
- Primary data sources:
BioRemPP_Results.xlsx or BioRemPP_Results.csv– regulatory annotation for compoundsToxCSM.xlsx or ToxCSM.csv– predicted toxicity scores and labels for compounds- Key columns:
- From
BioRemPP_Results.xlsx or BioRemPP_Results.csv:referenceAG– identifier for the regulatory or scientific agency (e.g., WFD, CONAMA, EPC)compoundname– name of the chemical compound
- From
ToxCSM.xlsx or ToxCSM.csv:compoundname– name of the chemical compound (must be linkable to BioRemPP)label_*– qualitative toxicity labels for individual endpoints (e.g., "High Toxicity")
- Entities represented in the chord diagram:
- Individual Regulatory Agencies (
referenceAG) - A synthetic "High Predicted Risk" category, aggregating all compounds predicted as highly toxic by ToxCSM
Analytical Workflow
-
Data Loading
The primary results tablesBioRemPP_Results.xlsx or BioRemPP_Results.csvandToxCSM.xlsx or ToxCSM.csvare loaded from their semicolon-delimited formats. -
Set Construction
Two types of sets are defined: - High Predicted Risk Set
A single set containing all uniquecompoundnamevalues that are labeled "High Toxicity" in at least one toxicological endpoint in the ToxCSM data. -
Regulatory Sets
For each uniquereferenceAGinBioRemPP_Results.xlsx or BioRemPP_Results.csv, a set of uniquecompoundnamevalues is constructed, representing the list of compounds monitored or referenced by that agency. -
Intersection Calculation
For every pair of sets (each regulatory set vs. the High Predicted Risk set, and optionally between agencies if desired), the script computes: - the size of the intersection (number of shared compounds), and
-
the size of each individual set (total unique compounds per entity).
-
Rendering
The resulting set sizes and intersection counts are used to build a chord diagram, where: - each entity (agency or "High Predicted Risk") is represented as an arc on the circle, and
- chords (ribbons) between arcs encode the number of shared compounds, with thickness proportional to the intersection size.
How to Read the Plot
- Outer Arcs (Nodes)
Each colored arc on the circumference corresponds to one Entity: - a Regulatory Agency (
referenceAG), or -
the "High Predicted Risk" category.
The length of the arc is proportional to the total number of unique compounds in that entity's set. -
Chords (Ribbons)
Ribbons between two arcs represent the intersection of their compound sets: - one end attached to an agency's arc,
-
the other attached to another agency or to the "High Predicted Risk" arc.
-
Chord Thickness
The thickness of a chord is directly proportional to the number of shared compounds. Thicker chords indicate larger overlaps, while thinner chords represent more limited intersection.
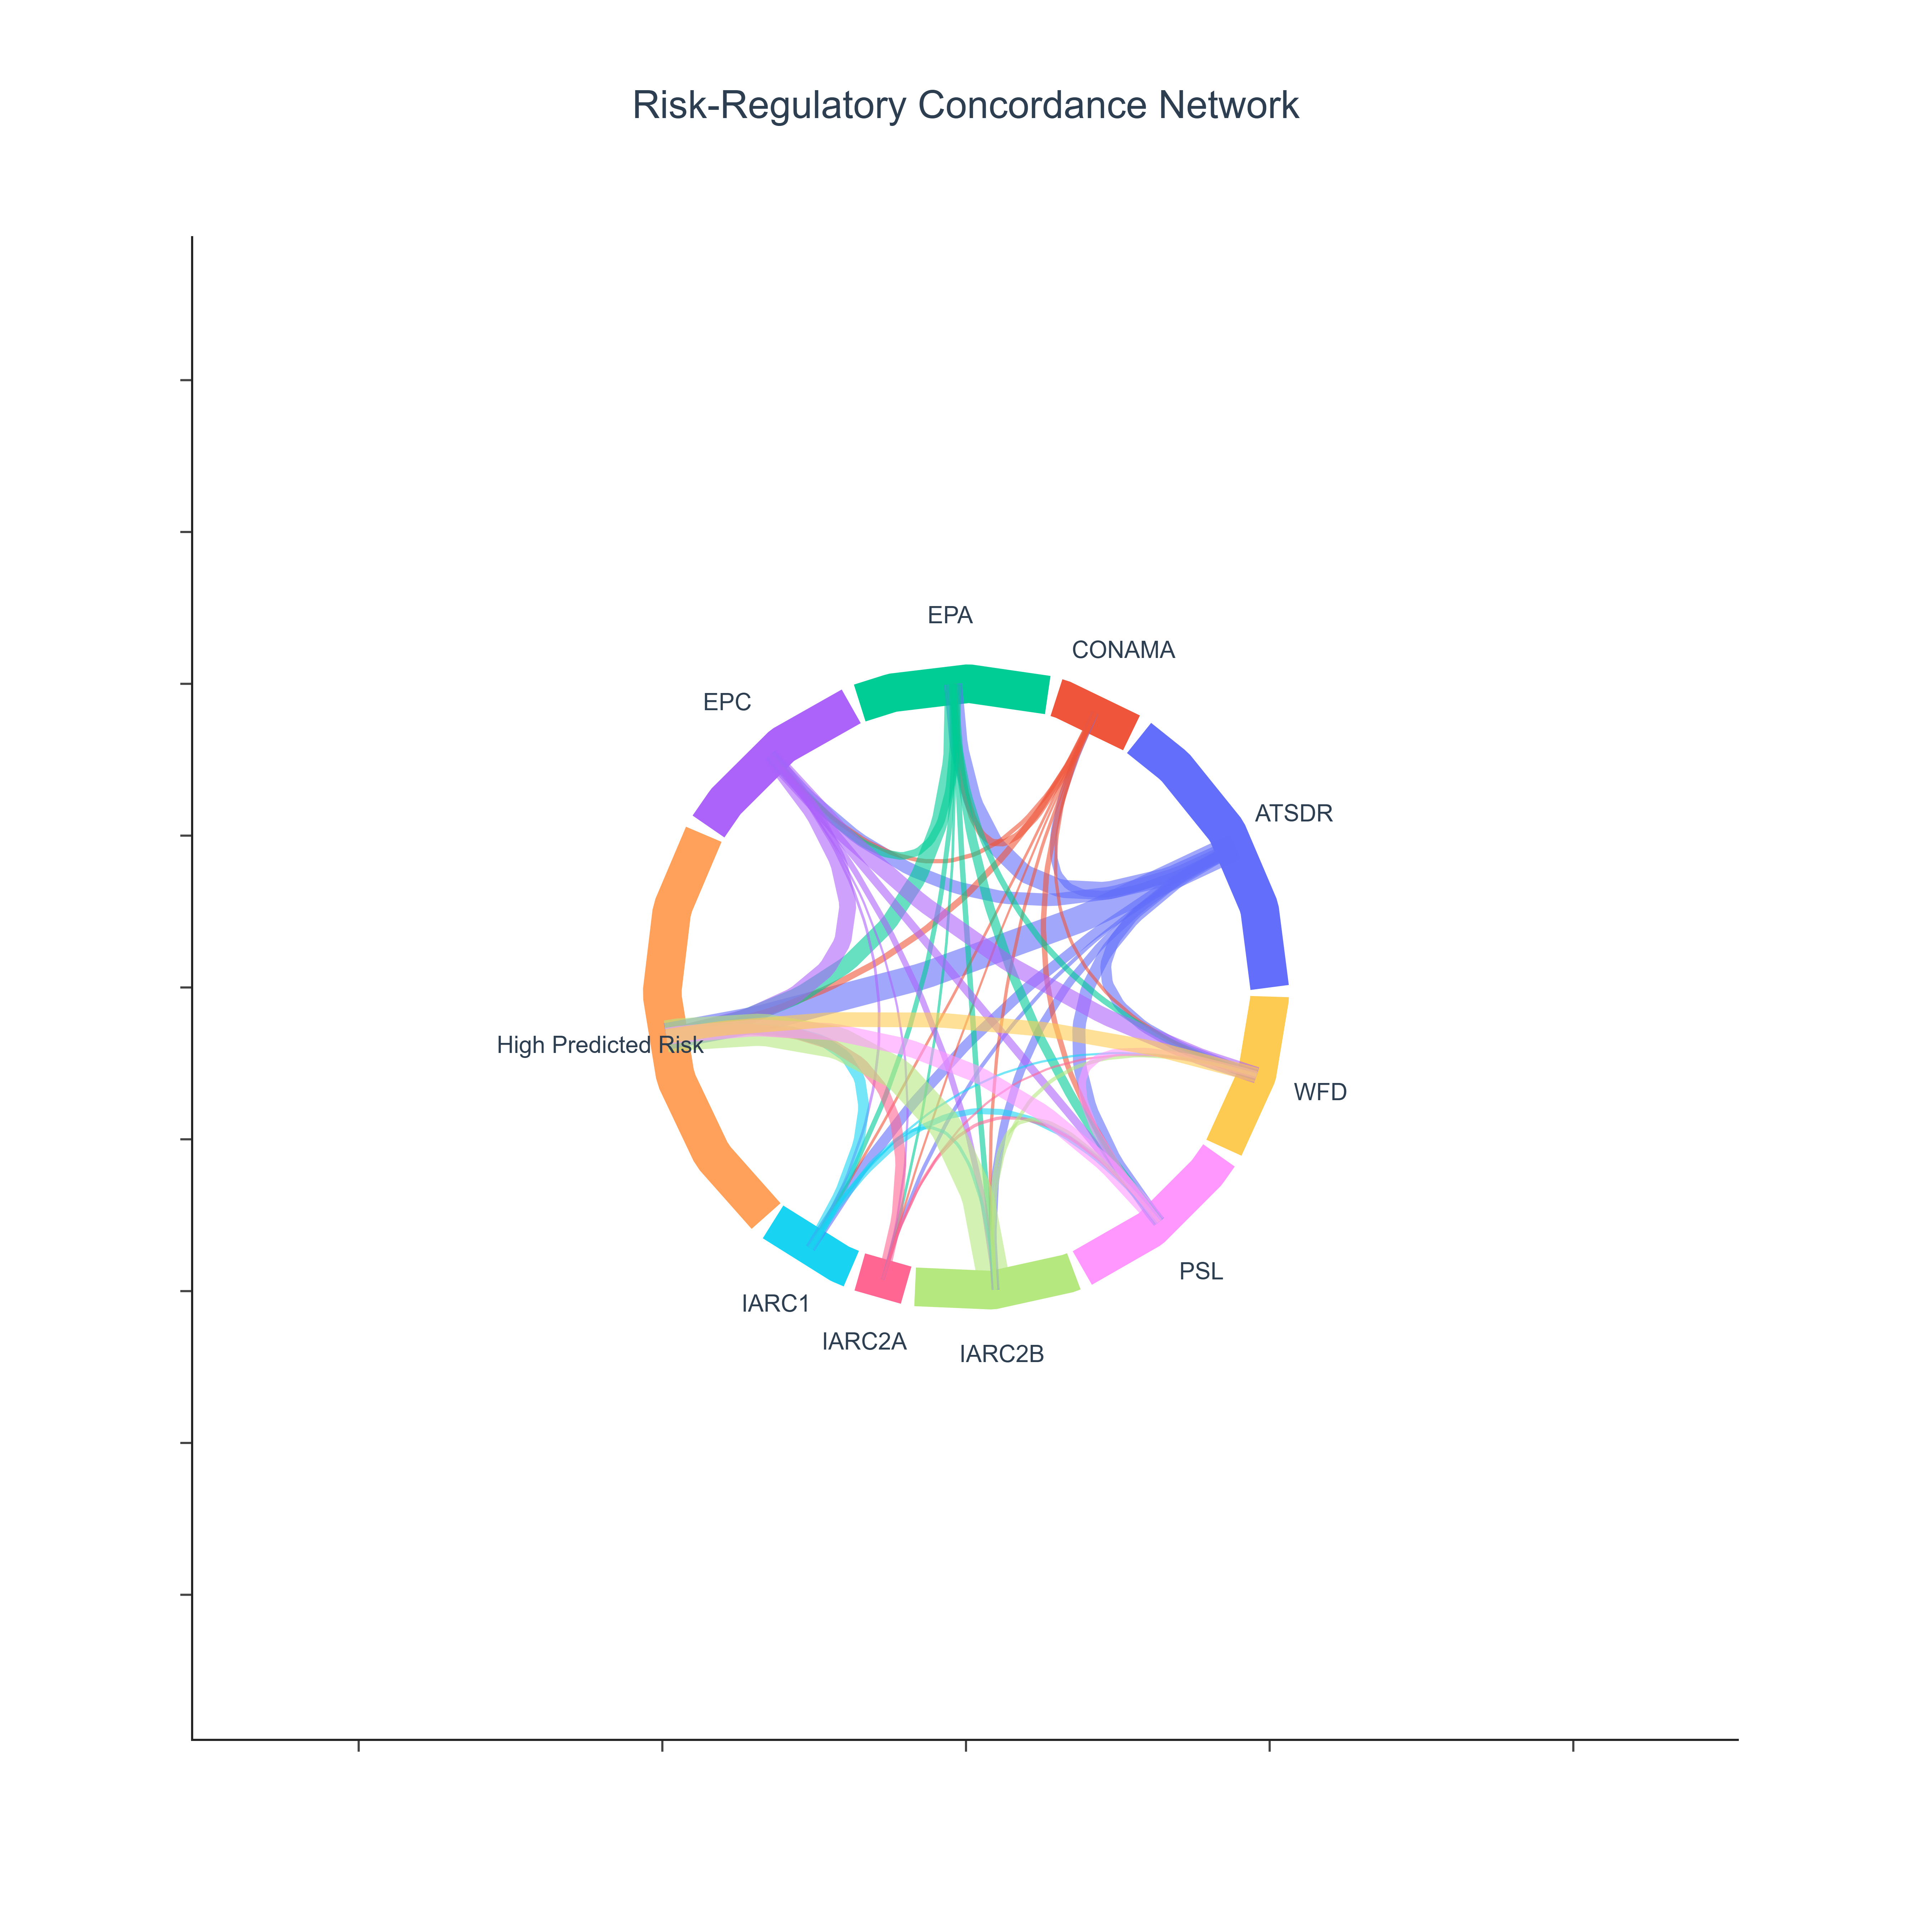
Representative Output
The image below illustrates a representative output generated by this use case using the example dataset.
Click on the image to enlarge and explore details.
Interpretation and Key Messages
-
Strong Concordance Between Regulation and Predicted Risk
A thick chord between a specific agency (e.g., "EPC") and the "High Predicted Risk" arc may indicate strong alignment: a substantial fraction of that agency's monitored compounds are also predicted by ToxCSM to be highly toxic. This may suggest that current regulations are capturing a large portion of model-predicted high-risk chemicals. -
Agency Scope and Focus
Agencies with larger outer arcs have broader monitored compound lists. By observing: - how much of the chord mass connects to "High Predicted Risk", versus
-
how much connects to other agencies,
one may infer whether an agency's broad scope is heavily focused on high-risk compounds or includes many lower-risk or region-specific targets. -
Gaps in Coverage
A relatively large "High Predicted Risk" arc with thin chords connecting to regulatory agencies may suggest that many model-predicted high-risk compounds are not prominently represented in the current regulatory lists. This could highlight: - emerging contaminants,
- under-regulated chemical classes, or
-
candidates for further risk assessment and potential regulatory inclusion.
-
Comparative Regulatory Strategies
Differences in chord patterns between agencies may reflect distinct regulatory strategies or priorities (e.g., some focusing on legacy pollutants, others on emerging contaminants), providing context for interpreting coverage gaps and overlaps.
Reproducibility and Assumptions
- Input Format
The analysis assumes: BioRemPP_Results.xlsx or BioRemPP_Results.csvis a semicolon-delimited table containing at leastreferenceAGandcompoundname, and-
ToxCSM.xlsx or ToxCSM.csvis a semicolon-delimited table containingcompoundnameand one or morelabel_*columns. -
Definition of "High Predicted Risk"
A compound is included in the High Predicted Risk Set if any of its toxicity labels in ToxCSM is classified as "High Toxicity" (or equivalent high-risk category), regardless of endpoint. -
Intersection Metric
The strength of the connection between entities is expressed as the absolute count of shared compounds, not weighted by toxicity magnitude, exposure, or frequency.
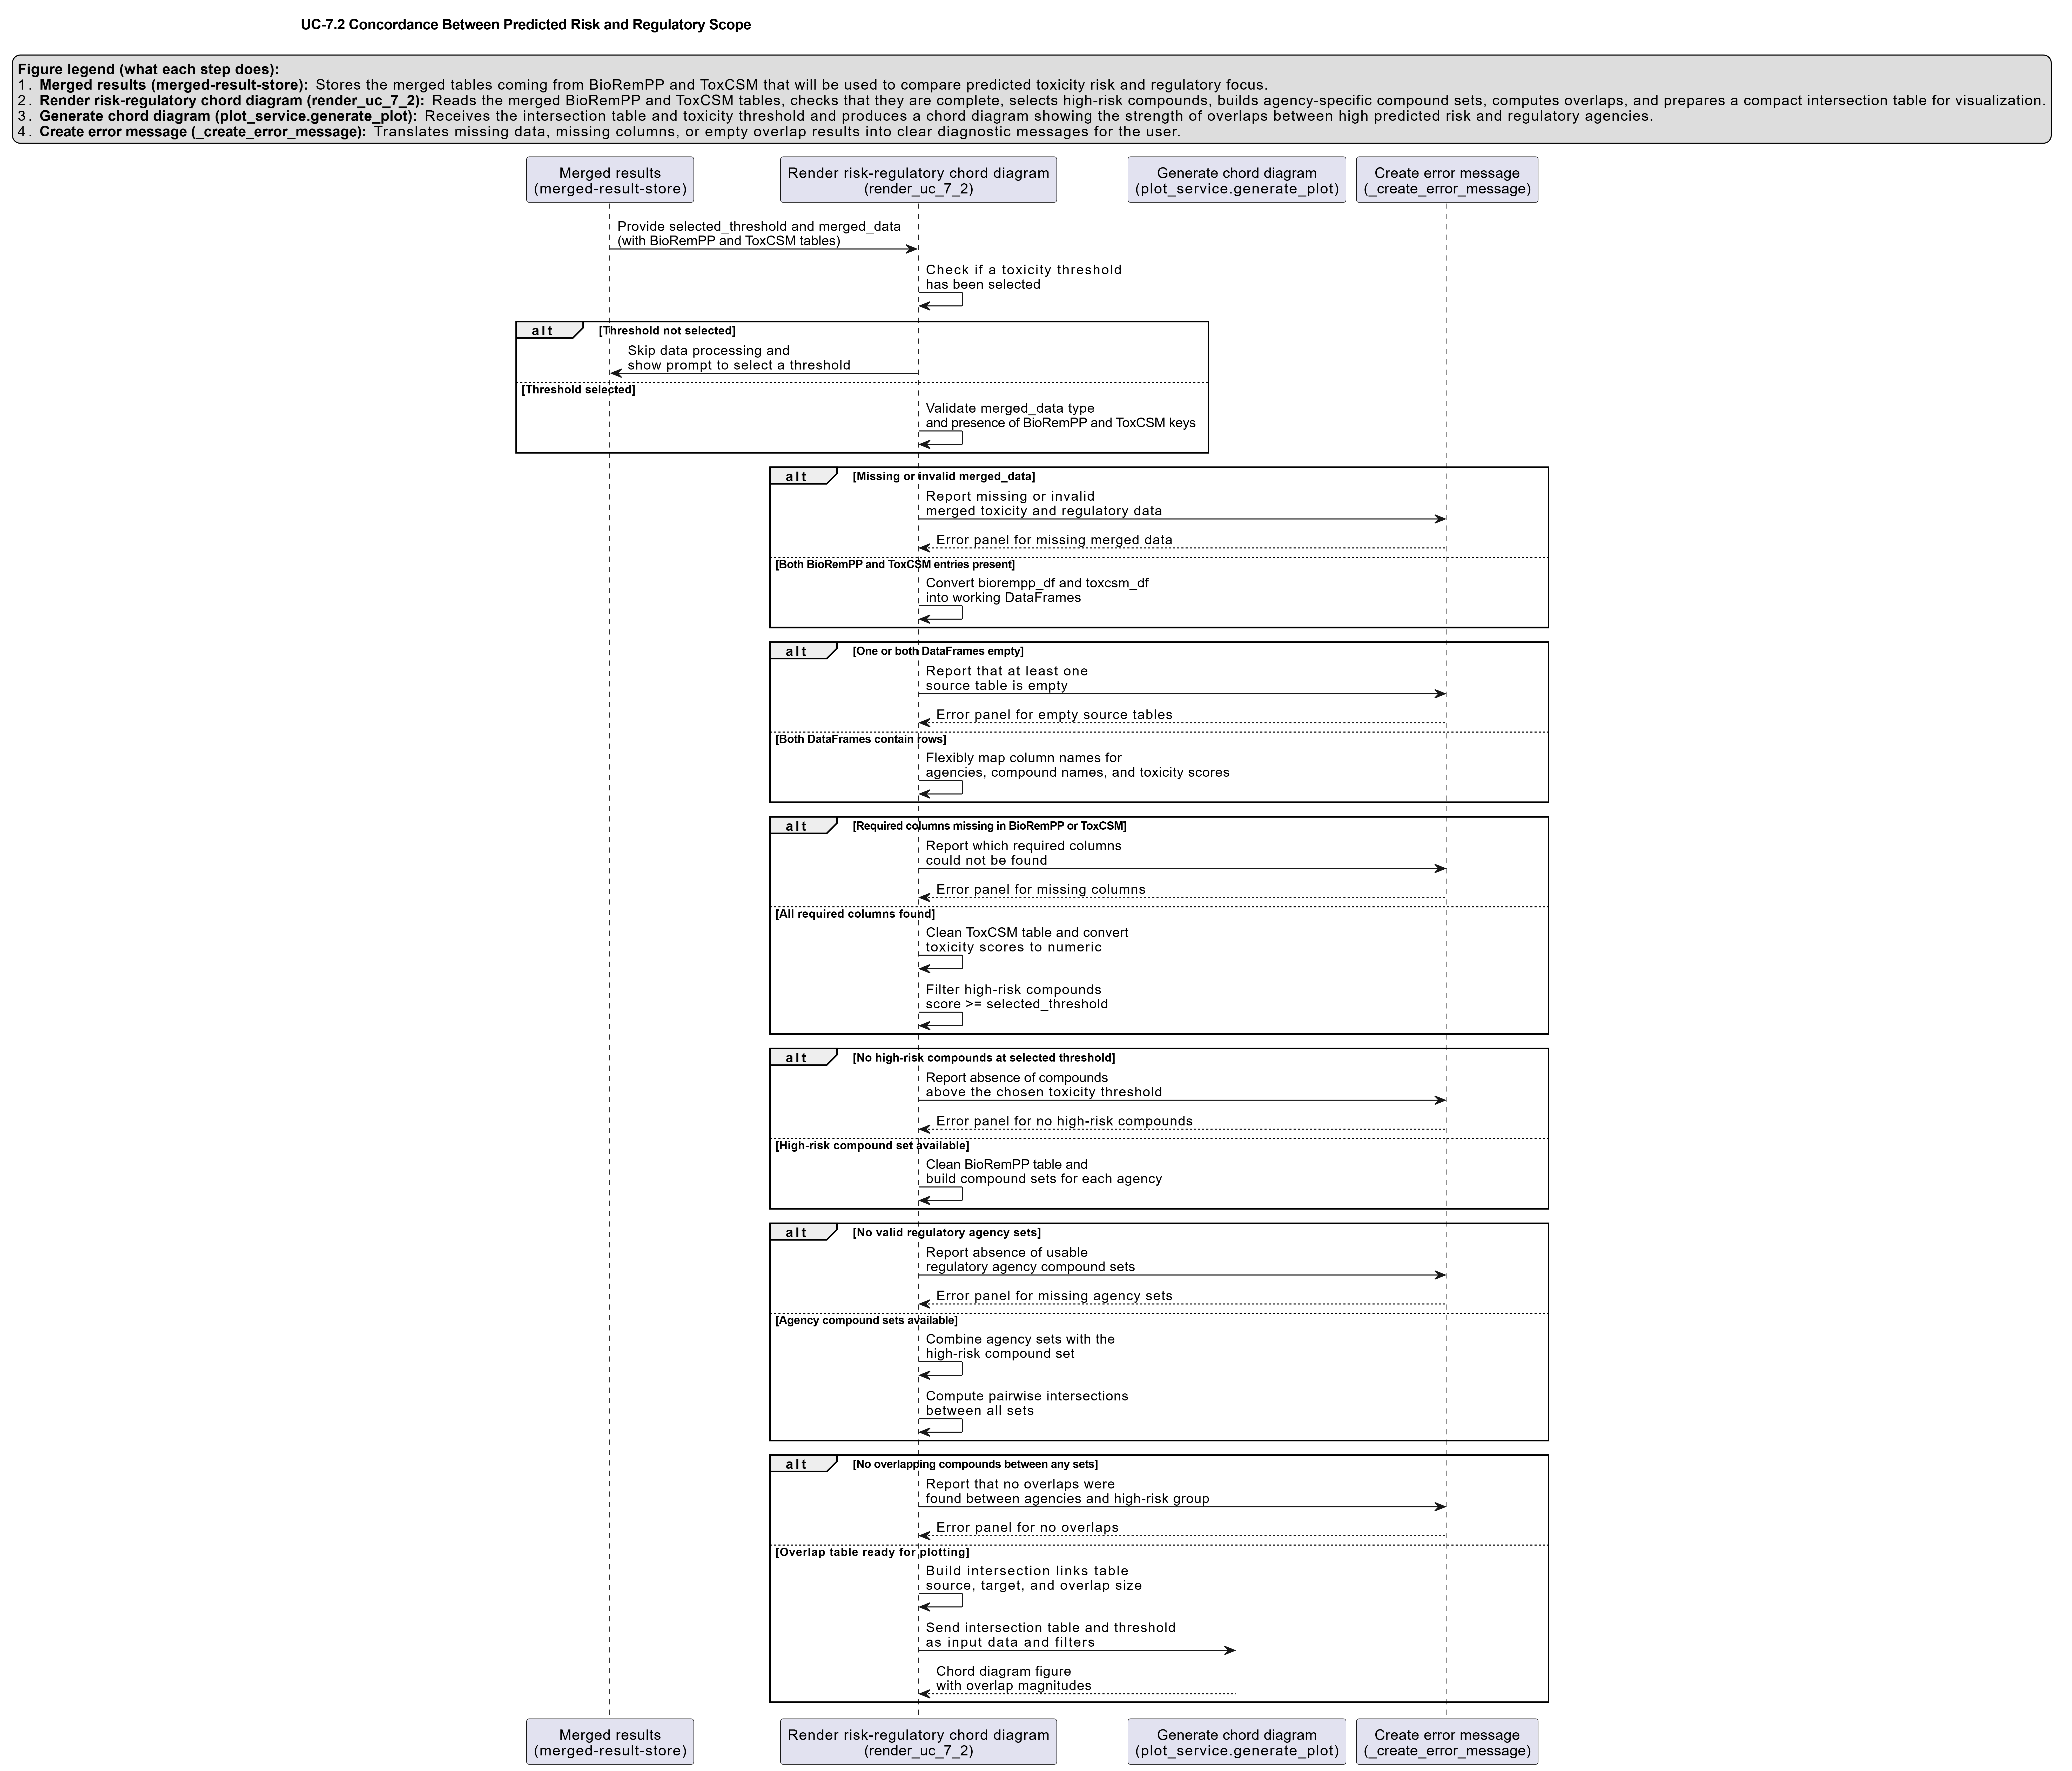
Activity diagram of the use case
Click on the image to enlarge and explore details.