UC-8.2 — BioRemPP Chemical Class Completeness Scorecard
Module: 8 – Assembly of Functional Consortia
Visualization type: Interactive heatmap (Completeness Score per sample–class pair)
Primary inputs: BioRemPP_Results.xlsx or BioRemPP_Results.csv (sample–KO–compound class associations)
Primary outputs: Matrix of per-sample Completeness Scores for each chemical class
Scientific Question and Rationale
Question: Which samples have the most "complete" KO annotation coverage for a given chemical class, and how can this be used to identify samples with high annotation completeness?
Rather than simply asking whether a sample is co-annotated with any compound from a class, the analysis quantifies how complete the sample's KO annotation coverage is for that class. This is achieved through a KO Annotation Completeness Score, which measures the fraction of all KEGG Orthology (KO) identifiers observed for a chemical class (within the dataset) that are present in a specific sample. The resulting scorecard can provide a quantitative, annotation-level basis for identifying samples with high KO coverage and assessing which classes may require multiple samples to achieve full KO annotation coverage (experimental validation required to confirm functional capacity).
Data and Inputs
- Primary data source:
BioRemPP_Results.xlsx or BioRemPP_Results.csv(semicolon-delimited) - Key columns:
sample– identifier for each biological sampleko– KEGG Orthology (KO) identifier-
compoundclass– chemical class associated with the KO–sample interaction -
Scorecard structure:
- Rows: Samples
- Columns: Compound Classes
- Cell value: Completeness Score (%) for a given
(sample, compoundclass)pair
Analytical Workflow
-
Data Loading
The primary results tableBioRemPP_Results.xlsx or BioRemPP_Results.csvis loaded from its semicolon-delimited format. -
Feature Engineering – Completeness Score
The Completeness Score is computed in three steps: - For each
compoundclass, determine the universe of unique KOs observed across all samples. - For each
(sample, compoundclass)pair, count the number of unique KOs that the sample possesses for that class. -
Compute the Completeness Score (%) as:
Completeness Score = (unique KOs in sample for that class / total unique KOs for that class) × 100. -
Matrix Construction
The per-pair Completeness Scores are reshaped into a 2D matrix: - rows represent
sample, - columns represent
compoundclass, -
cell values store the corresponding Completeness Score (%).
-
Rendering as Heatmap
The matrix is rendered as an interactive heatmap: - color intensity is proportional to the Completeness Score,
- numeric labels (optional) can be overlaid in each cell to show the exact percentage.
How to Read the Plot
-
Y-axis (Rows)
Each row corresponds to a single Sample. -
X-axis (Columns)
Each column corresponds to a Compound Class defined in the BioRemPP dataset. -
Cells (Color and Label)
- The color intensity of each cell encodes the Completeness Score (%) for that sample–class pair.
- Brighter or warmer colors indicate higher completeness, while darker or cooler colors indicate lower completeness.
- If enabled, the numeric label in the cell shows the exact percentage value.
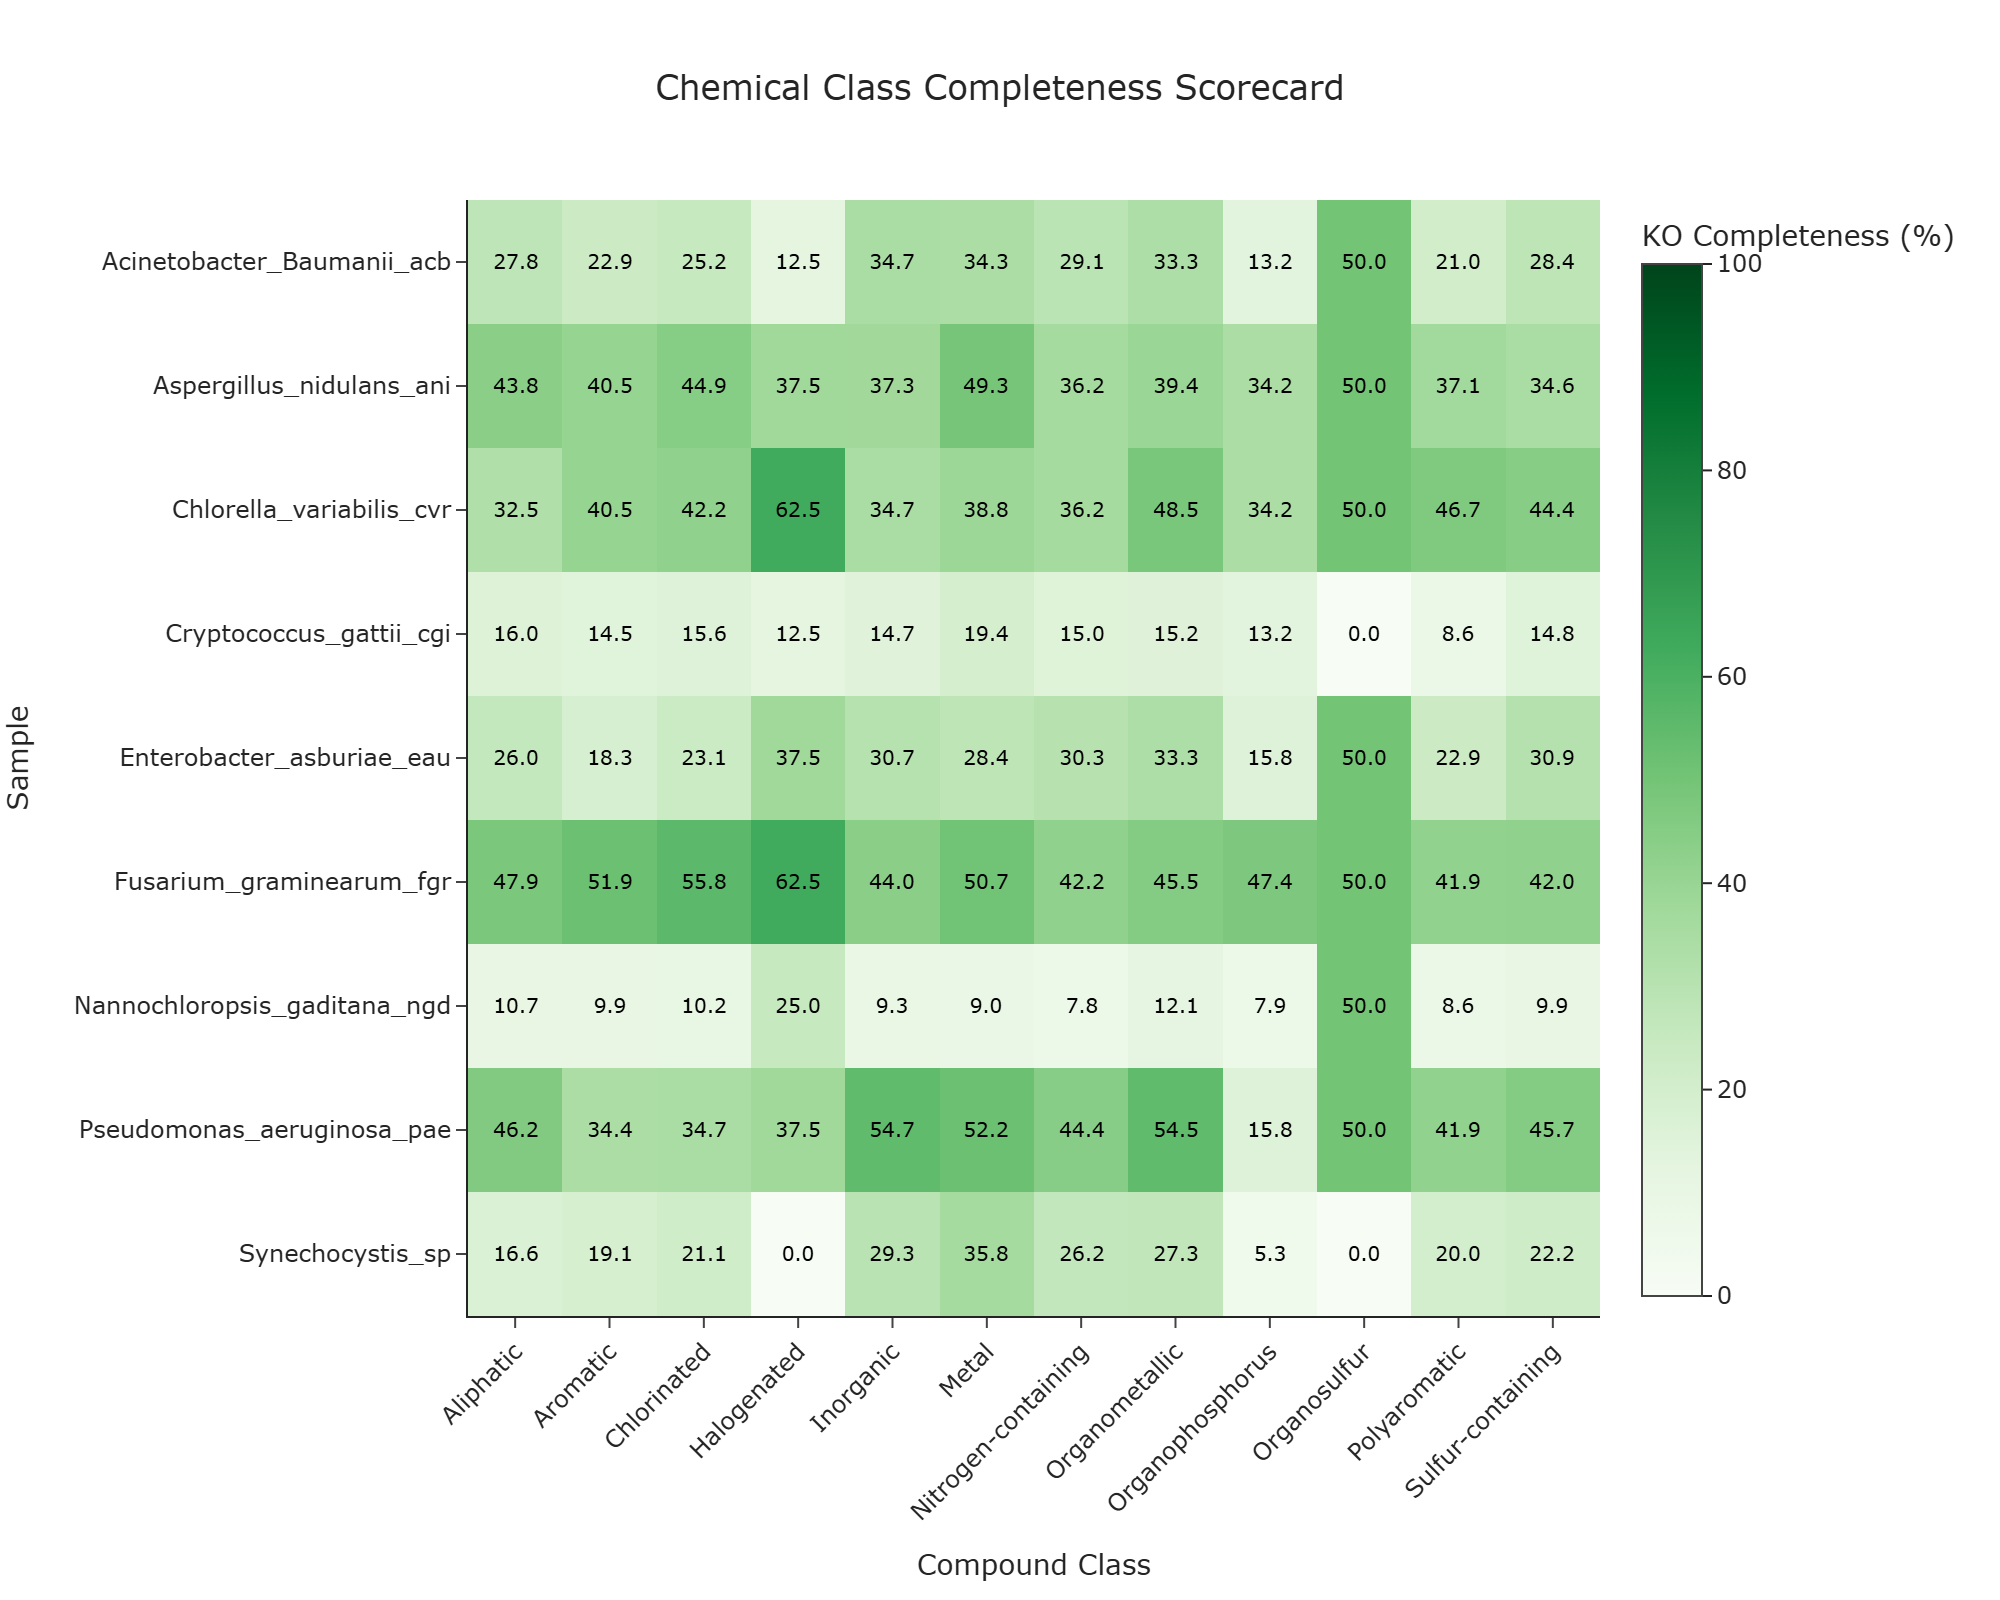
Representative Output
The image below illustrates a representative output generated by this use case using the example dataset.
Click on the image to enlarge and explore details.
Interpretation and Key Messages
- Samples with High KO Annotation Completeness Brightly colored cells ("hotspots") may identify samples with high KO annotation completeness for specific chemical classes:
- a score close to 100% means the sample contains all KOs observed for that class in the entire dataset,
-
such samples could be strong annotation-level candidates for prioritized experimental investigation for that chemical class.
-
Comparing KO Annotation Coverage Across Classes Reading across a row (left to right) may reveal the annotation breadth of a given sample:
- multiple high-scoring cells may indicate a sample with broad KO annotation coverage across several classes,
-
a row with only one or two hotspots may suggest a sample with narrower, more focused annotation coverage.
-
Assessing KO Coverage for Chemical Classes Reading down a column (top to bottom) may reveal how well a given class is covered by the dataset:
- if no sample reaches a high Completeness Score, the class may have distributed KO coverage across samples,
-
such classes may require multiple candidate samples to achieve full KO annotation coverage in a consortium design hypothesis.
-
Annotation-guided Candidate Selection By combining:
- high-scoring samples for classes with distributed KO coverage, and
- broadly annotated samples with moderate scores across multiple classes, users can generate annotation-based hypotheses for consortia that may cover the chemical space of interest (experimental validation required).
Reproducibility and Assumptions
- Input Format
The analysis requires a semicolon-delimited BioRemPP results table with at least the columns: sample,ko,-
compoundclass. -
Definition of KO Universe
For eachcompoundclass, the "total universe" of KOs is defined solely by the dataset: - it is the set of all unique KOs observed for that class across all samples in
BioRemPP_Results.xlsx or BioRemPP_Results.csv, -
no external canonical or exhaustive KO reference is used.
-
Normalization
The Completeness Score is expressed as a percentage, allowing for fair comparison between classes that differ in their total KO counts (e.g., simple vs. complex classes). -
Data Consistency
Interpretation assumes: - consistent use of
sample,ko, andcompoundclassidentifiers, -
no major annotation biases that selectively omit pathways for particular samples or classes.
-
Modeling Scope The Completeness Score reflects KO annotation presence, not kinetic performance, expression levels, confirmed functional capacity, or environmental constraints. It should be interpreted as a KO annotation coverage metric, complementary to other annotation-level and toxicological analyses in BioRemPP.
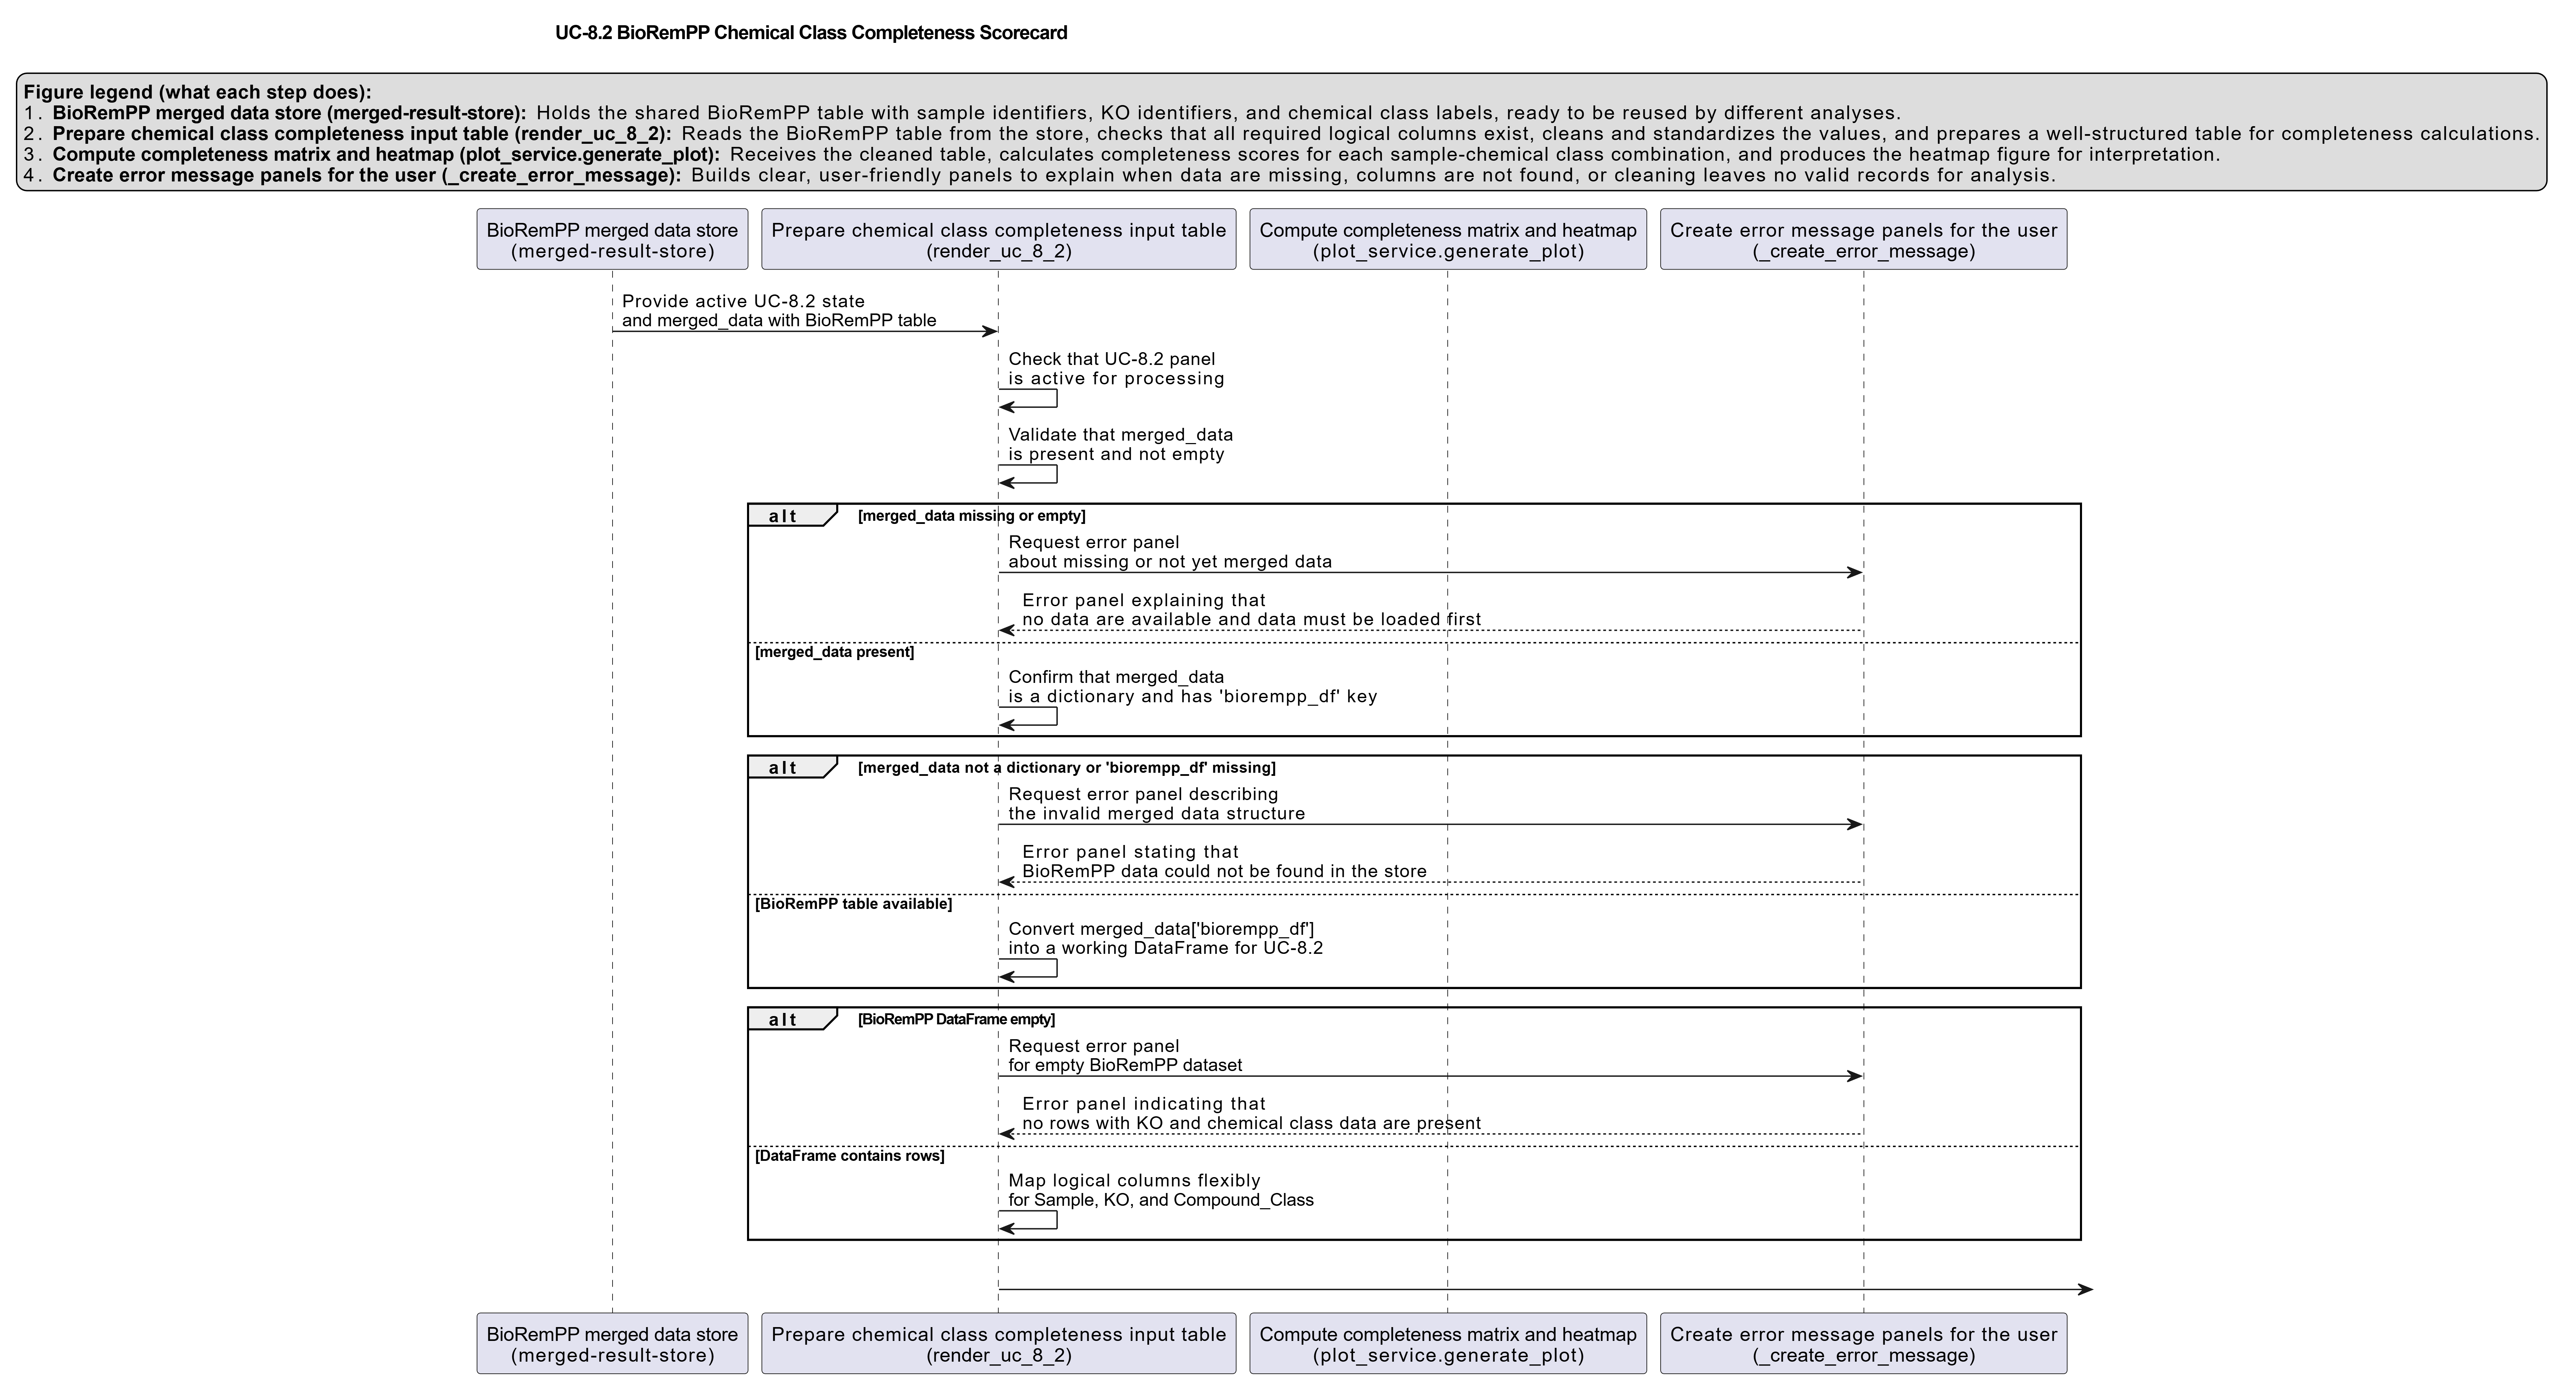
Activity diagram of the use case
Click on the image to enlarge and explore details.