UC-8.3 — Compound-Specific KO Completeness Scorecard
Module: 8 – Assembly of Functional Consortia
Visualization type: Interactive heatmap (KO Completeness Score per sample–compound pair)
Primary inputs: BioRemPP_Results.xlsx or BioRemPP_Results.csv (sample–KO–compound associations)
Primary outputs: Matrix of per-sample KO Completeness Scores for individual compounds
Scientific Question and Rationale
Question: For any given chemical compound, which sample has the most "complete" KO annotation coverage?
This use case provides the most fine-grained annotation-level view in BioRemPP. Instead of working at the chemical class level, the analysis is performed compound by compound, computing a KO Completeness Score that quantifies, for each sample, what fraction of the KEGG Orthology (KO) identifiers associated with a specific compound (within the dataset) are present in that sample. The resulting scorecard can enable precise identification of samples with high KO annotation completeness for individual compounds and may clarify which compounds have distributed KO coverage across samples (experimental validation required to confirm degradation capacity).
Data and Inputs
- Primary data source:
BioRemPP_Results.xlsx or BioRemPP_Results.csv(semicolon-delimited) - Key columns:
sample– identifier for each biological sampleko– KEGG Orthology (KO) identifier-
compoundname– chemical compound associated with the KO–sample interaction -
Scorecard structure:
- Rows: Samples
- Columns: Individual Compound Names
- Cell value: KO Completeness Score (%) for each
(sample, compoundname)pair
Analytical Workflow
-
Data Loading
The primary BioRemPP results tableBioRemPP_Results.xlsx or BioRemPP_Results.csvis loaded from its semicolon-delimited format. -
Feature Engineering – KO Completeness Score
For each compound, a three-step procedure is applied: -
KO Universe per Compound
For eachcompoundname, determine the universe of unique KOs associated with that compound across all samples in the dataset. -
Sample-Specific KO Count
For each(sample, compoundname)pair, count the number of unique KOs that the sample possesses for that compound. -
Score Calculation
Compute the KO Completeness Score (%) as:
KO Completeness Score = (unique KOs in sample for that compound / total unique KOs for that compound) × 100. -
Matrix Construction
The per-pair scores are reshaped into a 2D matrix: - rows represent
sample, - columns represent
compoundname, -
cell values store the KO Completeness Score (%).
-
Rendering as Heatmap
The matrix is rendered as an interactive heatmap: - color intensity is proportional to the KO Completeness Score,
- optional numeric labels in cells can display the exact percentage.
How to Read the Plot
-
Y-axis (Rows)
Each row corresponds to a single Sample. -
X-axis (Columns)
Each column corresponds to an individual Compound Name. -
Cells (Color and Optional Label)
- The color intensity of each cell encodes the KO Completeness Score (%) for that sample–compound pair.
- Brighter or warmer colors indicate a more complete KO repertoire for that compound.
- If enabled, numeric labels provide the exact percentage.
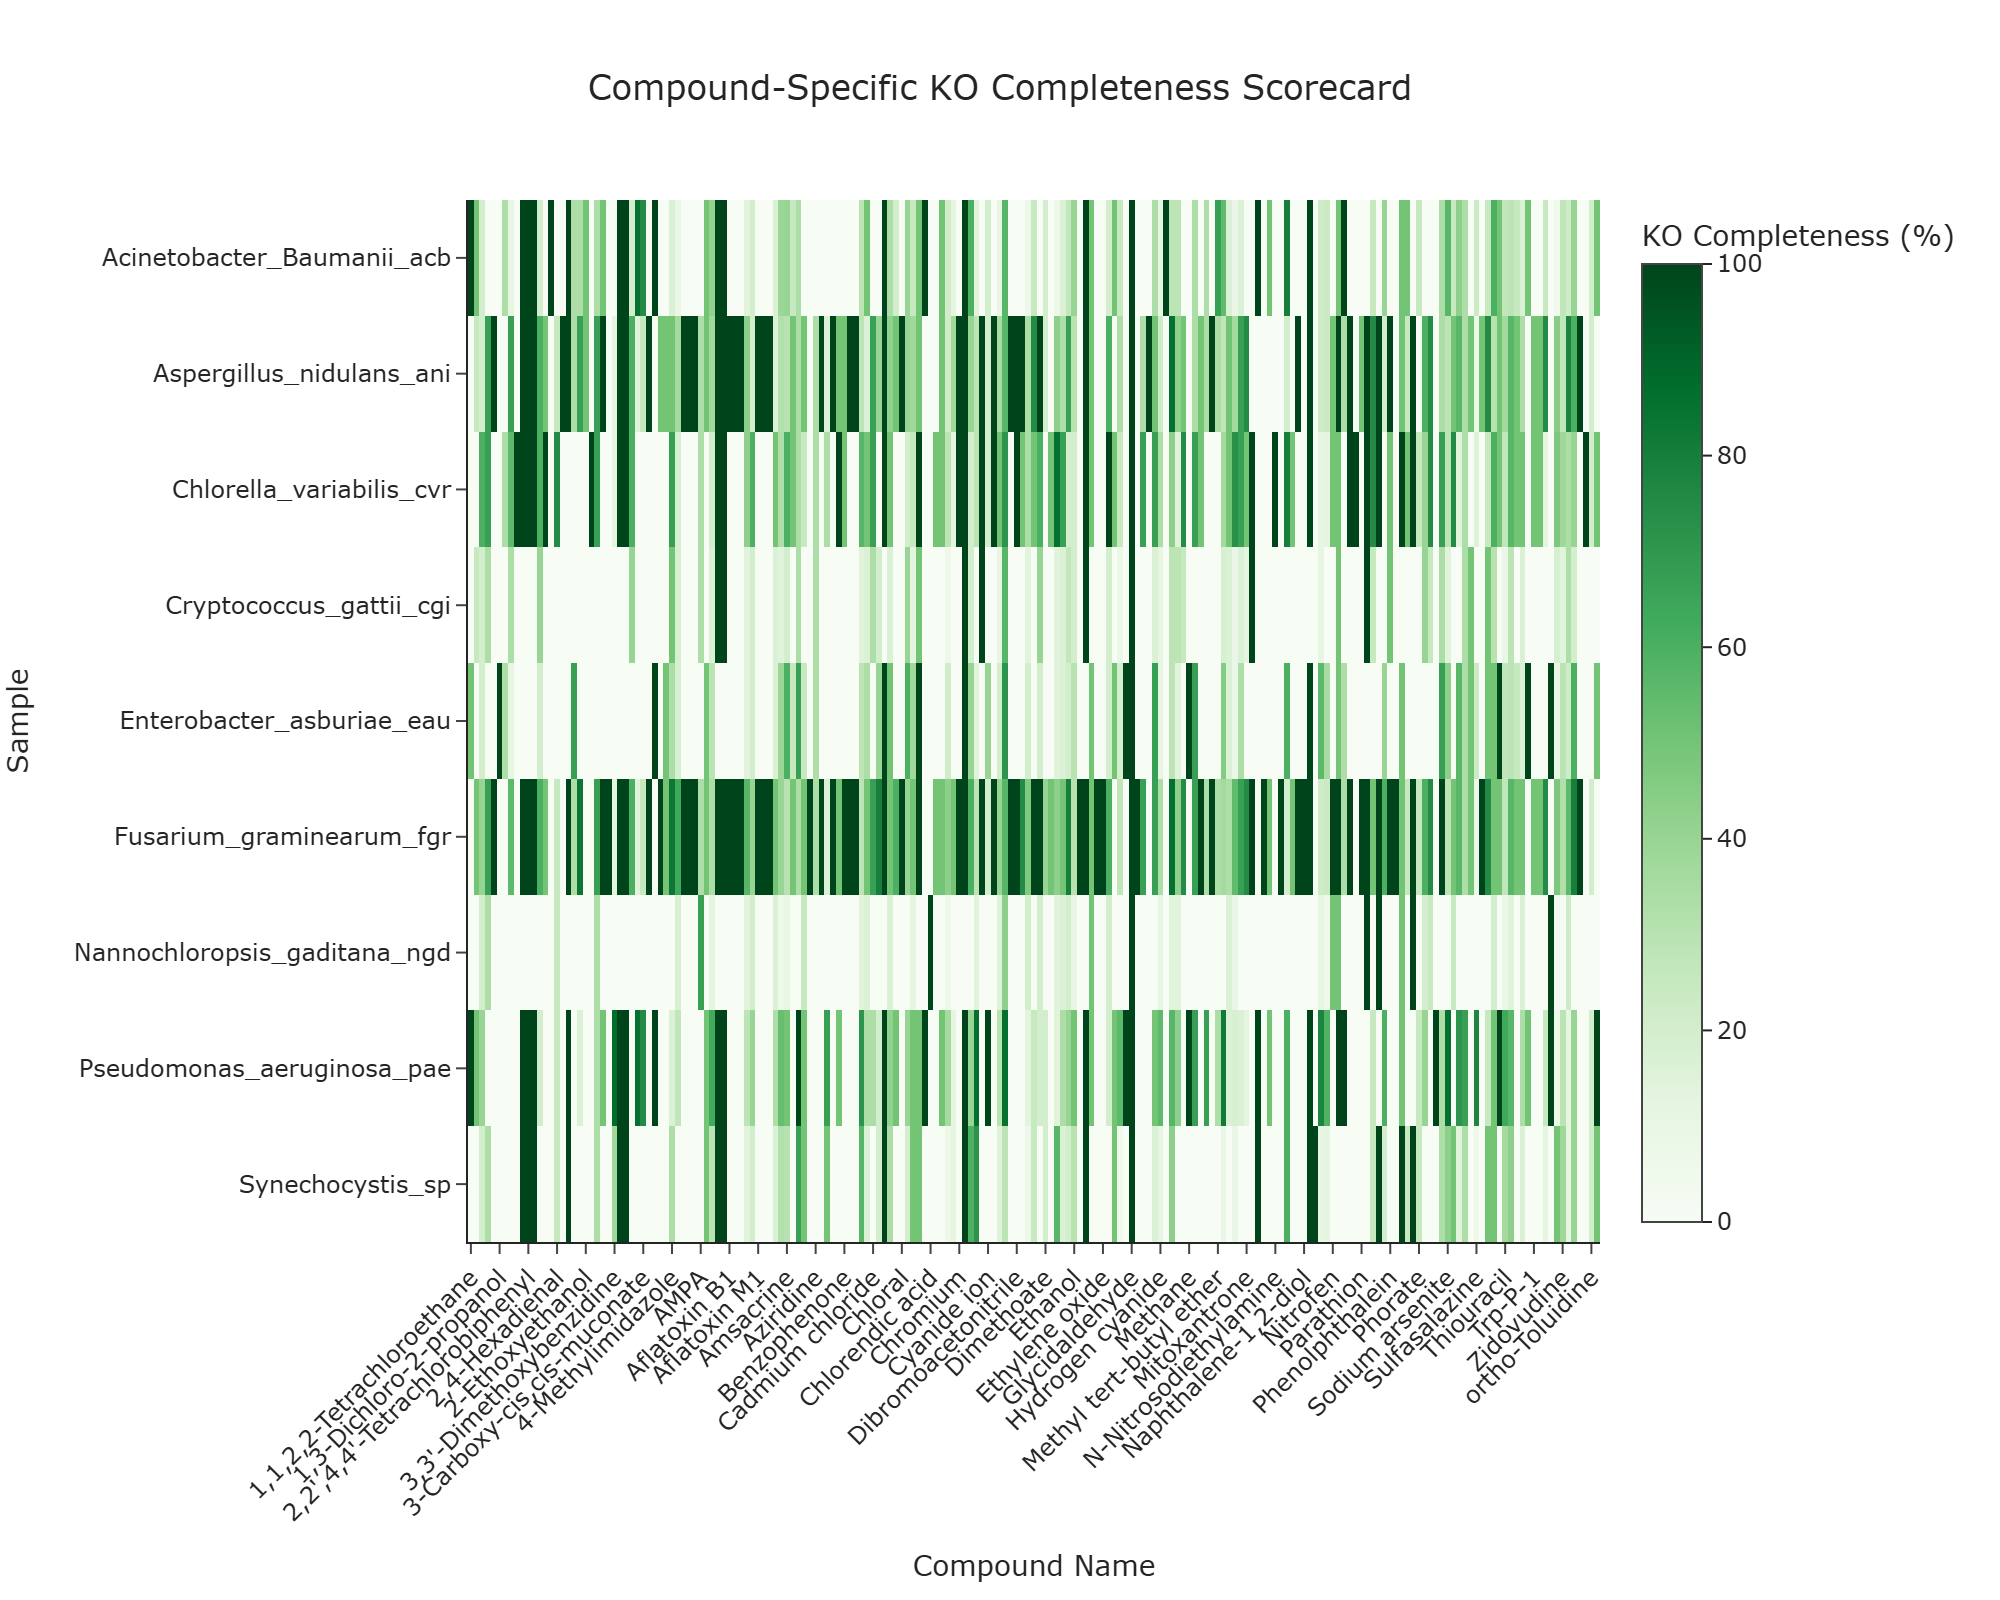
Representative Output
The image below illustrates a representative output generated by this use case using the example dataset.
Click on the image to enlarge and explore details.
Interpretation and Key Messages
- Samples with High KO Completeness for Specific Compounds Brightly colored cells ("hotspots") may highlight samples with high KO annotation completeness for individual compounds:
- a 100% score indicates that the sample has all KOs associated with that compound in the dataset,
-
such samples could be prime annotation-level candidates for prioritized experimental investigation for that specific compound.
-
Profiling Sample KO Coverage at Compound Resolution Reading across a row may reveal a high-resolution profile of a sample's KO annotation coverage:
- a sample with high scores for several distinct compounds has broad KO annotation coverage across multiple targets,
-
a sample with a hotspot for only one or two compounds shows narrower, focused annotation coverage for those specific compounds.
-
Assessing Distributed KO Coverage per Compound Reading down a column may reveal how distributed a compound's KO coverage is across samples:
- if no sample achieves a high KO Completeness Score, the compound has distributed KO coverage across multiple samples,
-
this may suggest that candidate consortia combining complementary KO annotation profiles from multiple samples could be relevant for complete KO coverage (experimental validation required).
-
Prioritization for Experimental Design
The score card can be used to: - prioritize single-sample experiments for compounds with clear elite specialists, and
- design multi-sample experiments for compounds with fragmented KO coverage.
Reproducibility and Assumptions
- Input Format
The analysis requires a semicolon-delimited BioRemPP results table containing at least: sample,ko,-
compoundname. -
Definition of KO Universe
For each compound, the "total universe" of KOs is defined by the dataset itself: - it includes all unique KOs observed for that compound across all samples in
BioRemPP_Results.xlsx or BioRemPP_Results.csv, -
no external canonical or exhaustive KO reference is used.
-
Normalization
The KO Completeness Score is expressed as a percentage, enabling meaningful comparison: - across compounds that differ in their total KO counts, and
-
across samples with varying overall annotation densities.
-
Interpretation Scope As with the class-level scorecard (UC-8.2), KO Completeness reflects KO annotation presence, not kinetic parameters, gene expression levels, confirmed functional capacity, or environmental regulation. It should be interpreted as a KO annotation coverage metric to be integrated with other BioRemPP analyses when generating hypotheses for candidate consortium assembly.
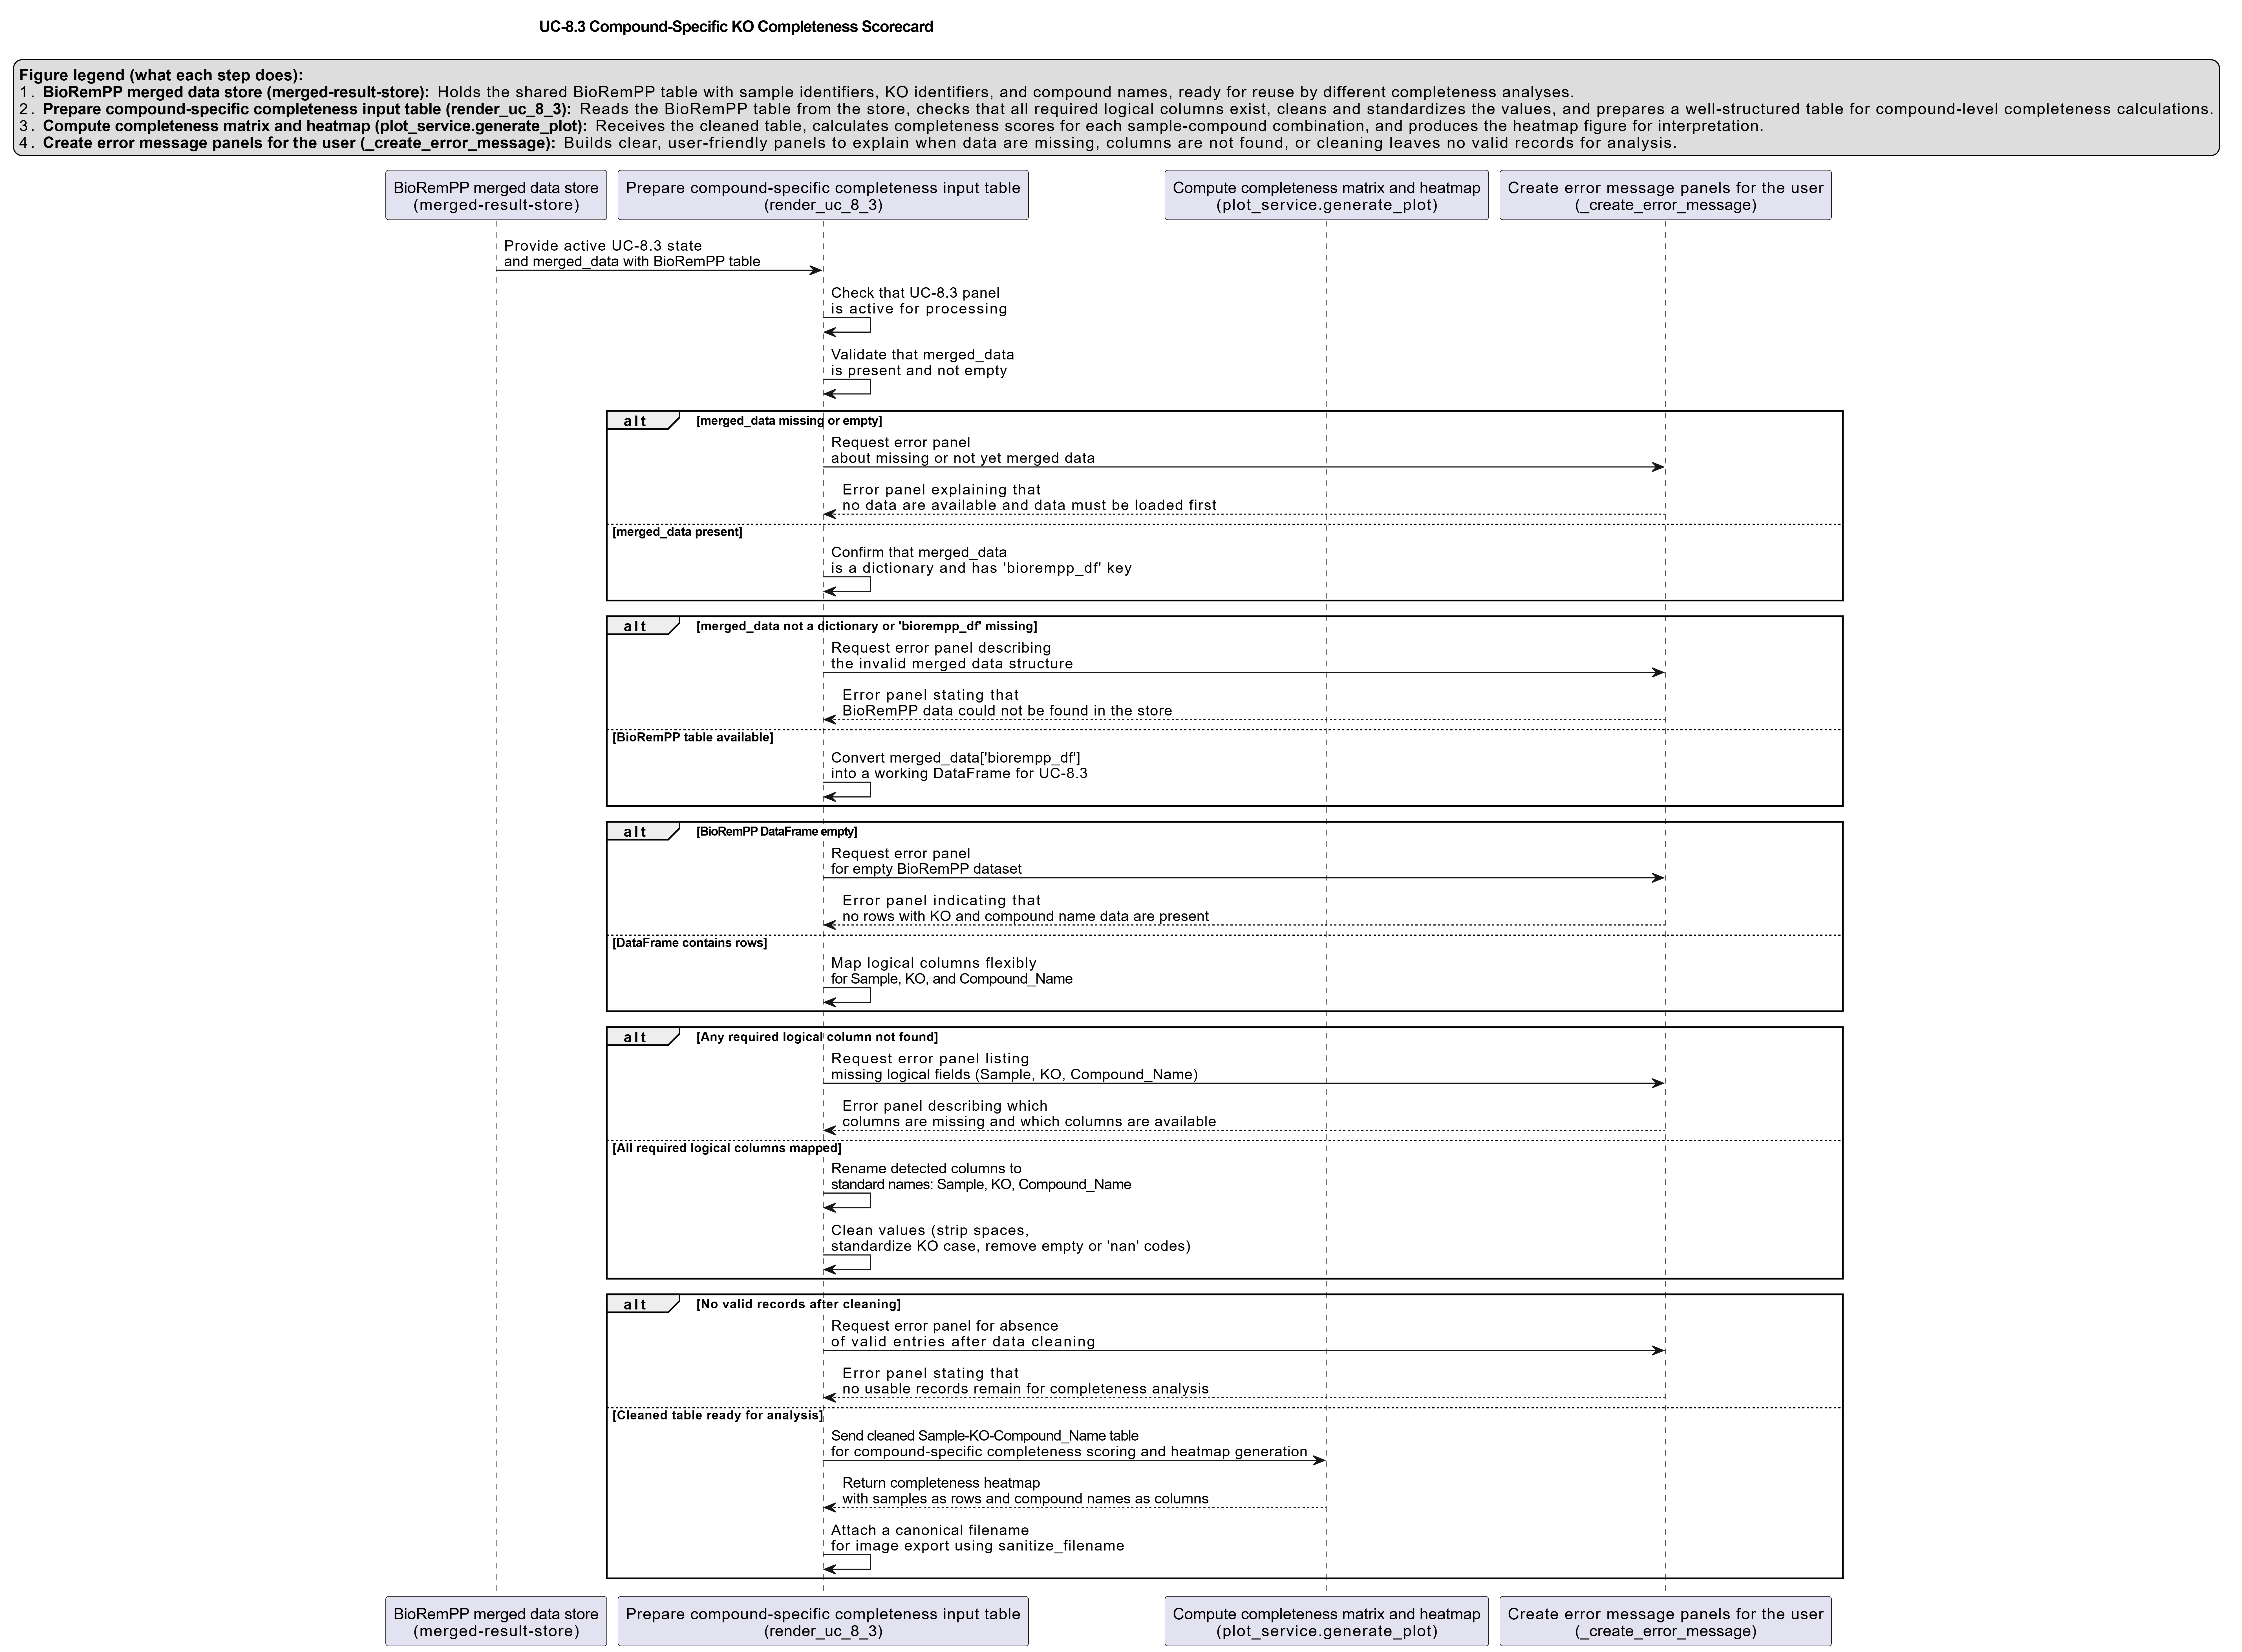
Activity diagram of the use case
Click on the image to enlarge and explore details.