UC-8.4 — HADEG Pathways Completeness Scorecard
Module: 8 – Assembly of Functional Consortia
Visualization type: Interactive heatmap (Pathway Completeness Score per sample–pathway pair)
Primary inputs: HADEG_Results.xlsx or HADEG_Results.csv (sample–KO–pathway associations)
Primary outputs: Matrix of per-sample Pathway Completeness Scores for HADEG degradation pathways
Scientific Question and Rationale
Question: Which samples have the most "complete" KO annotation coverage for a given HADEG degradation pathway, and how can this be used to compare pathway-level annotation completeness across samples?
This use case focuses on pathway-level KO annotation completeness using degradation pathways curated in the HADEG database. For each HADEG pathway, the analysis quantifies how many of the KEGG Orthology (KO) identifiers associated with that pathway are present in a given sample. The resulting Pathway Completeness Score (expressed as a percentage) may allow identification of samples with high KO annotation completeness for specific pathways, comparison of KO coverage across samples, and assessment of which pathways have distributed KO coverage across multiple samples (experimental validation required to confirm functional capacity).
Data and Inputs
- Primary data source:
HADEG_Results.xlsx or HADEG_Results.csv(semicolon-delimited) - Key columns:
sample– identifier for each biological sampleko– KEGG Orthology (KO) identifier annotated for that sample-
compound_pathway– HADEG pathway label associated with the KO -
Scorecard structure:
- Rows: Samples
- Columns: HADEG degradation pathways (
compound_pathway) - Cell value: Pathway Completeness Score (%) for each
(sample, pathway)pair
Analytical Workflow
-
Data Loading
The HADEG analysis results tableHADEG_Results.xlsx or HADEG_Results.csvis loaded from its semicolon-delimited format. -
Feature Engineering – Pathway Completeness Score
For each HADEG pathway, a three-step calculation is performed: -
KO Universe per Pathway
For eachcompound_pathway, determine the universe of unique KOs observed for that pathway across all samples. -
Sample-Specific KO Count
For each(sample, compound_pathway)pair, count the number of unique KOs that the sample possesses for that pathway. -
Score Calculation
Compute the Pathway Completeness Score (%) as:
Pathway Completeness Score = (unique KOs in sample for that pathway / total unique KOs for that pathway) × 100. -
Matrix Construction
The per-pair scores are reshaped into a 2D matrix: - rows represent
sample, - columns represent
compound_pathway, -
cell values store the Pathway Completeness Score (%).
-
Rendering as Heatmap
The matrix is rendered as an interactive heatmap: - cell color intensity is proportional to the Pathway Completeness Score,
- optional numeric labels can display the exact percentage value inside each cell.
How to Read the Plot
-
Y-axis (Rows)
Each row corresponds to a single Sample. -
X-axis (Columns)
Each column corresponds to a HADEG Compound Pathway (compound_pathway). -
Cells (Color and Label)
- The color intensity of each cell encodes the Pathway Completeness Score (%) for the corresponding sample–pathway pair.
- Brighter or warmer colors indicate higher pathway completeness, while darker or cooler colors indicate lower completeness.
- If enabled, the numeric label within a cell shows the exact percentage.
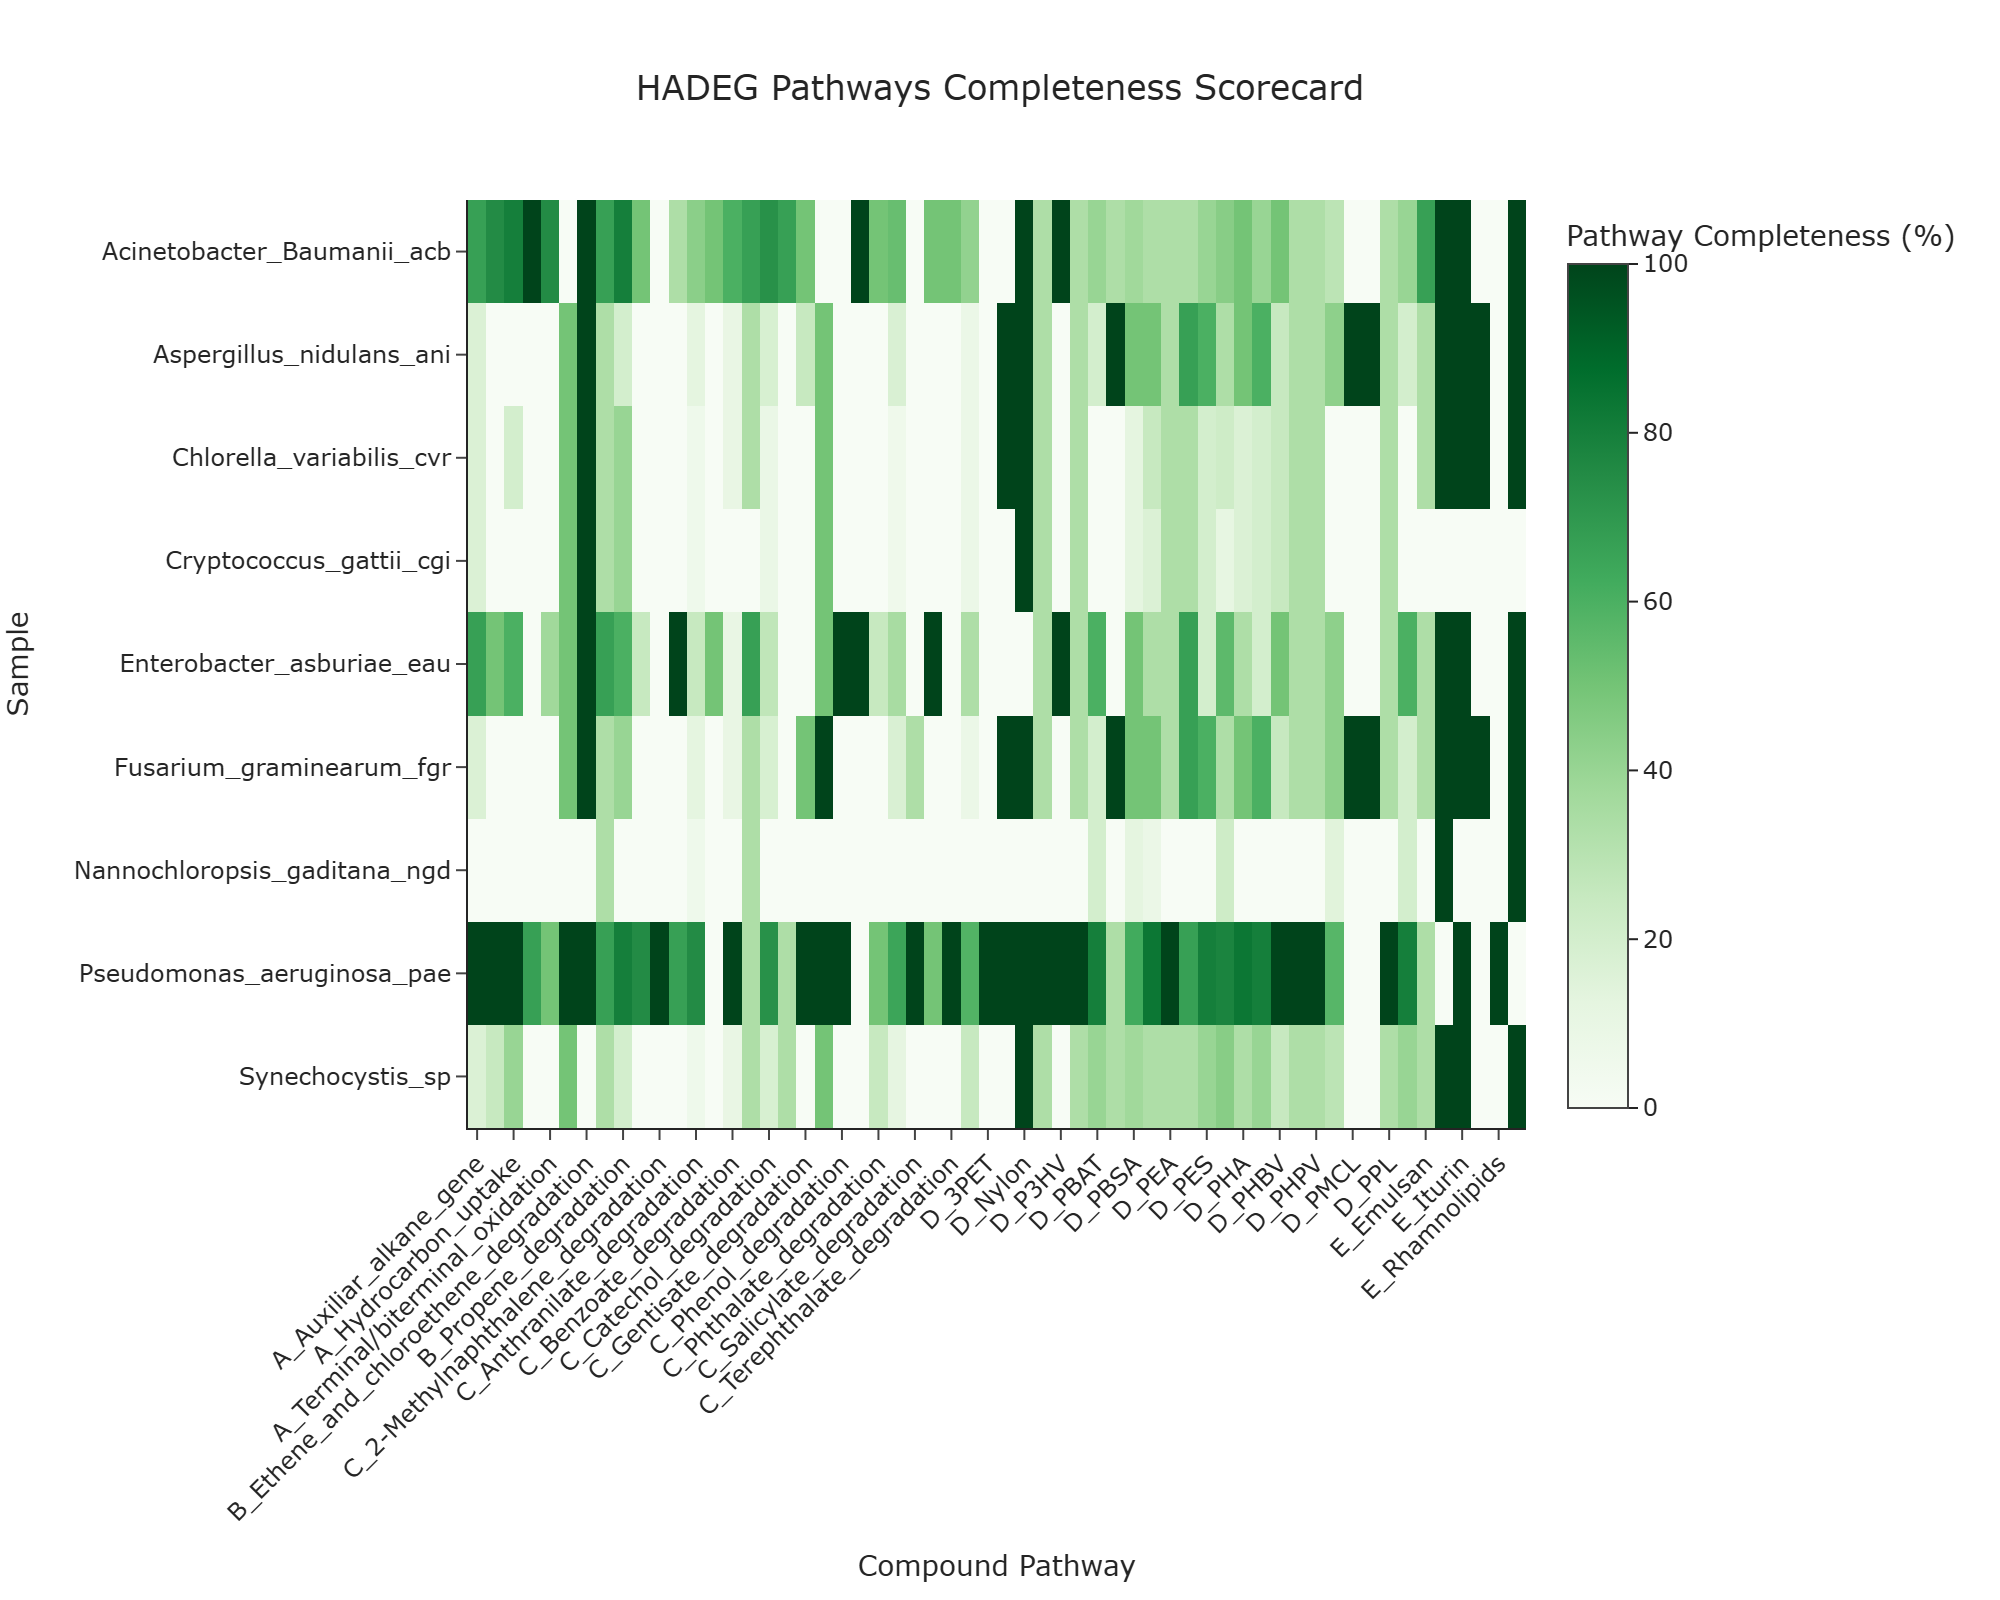
Representative Output
The image below illustrates a representative output generated by this use case using the example dataset.
Click on the image to enlarge and explore details.
Interpretation and Key Messages
- Samples with High Pathway KO Completeness Brightly colored cells ("hotspots") may highlight samples with high KO annotation completeness for specific pathways:
- a 100% score indicates that the sample has all KOs associated with the pathway in the dataset,
-
such samples could be annotation-level candidates for prioritized experimental investigation for that HADEG pathway.
-
Comparing KO Annotation Coverage Across Pathways Reading across a row (left to right) may reveal the range of pathway KO coverage for a sample:
- multiple high-scoring cells may indicate a sample with broad KO annotation coverage across several pathways,
-
one or two isolated hotspots may indicate a sample with narrower, pathway-focused annotation coverage.
-
Assessing Distributed KO Coverage per Pathway Reading down a column (top to bottom) may reveal how distributed a pathway's KO coverage is across samples:
- if no sample achieves a high completeness score, the pathway has distributed KO coverage across multiple samples,
-
such pathways may be candidates for multi-sample annotation complementarity analyses (experimental validation required to confirm full functional coverage).
-
Annotation-guided Consortium Hypothesis Generation with HADEG Pathways This scorecard can support pathway-centric hypothesis generation:
- samples with high completeness for different pathways may be combined as candidates for a multi-pathway consortium,
- or multiple samples with partially overlapping coverage of a single pathway may be explored as candidates for complementary KO coverage (experimental validation required).
Reproducibility and Assumptions
- Input Format
The analysis requires a semicolon-delimited HADEG results table containing at least: sample,ko,-
compound_pathway. -
Definition of KO Universe per Pathway
For eachcompound_pathway, the "total universe" of KOs is defined by the dataset: - it includes all unique KOs observed for that pathway across all samples in
HADEG_Results.xlsx or HADEG_Results.csv, -
no external canonical pathway definition is imported or enforced.
-
Normalization
The Pathway Completeness Score is expressed as a percentage, enabling fair comparison: - between pathways with different total KO counts, and
-
between samples with variable annotation density.
-
Interpretation Scope As with other completeness metrics in Module 8, the Pathway Completeness Score measures KO annotation presence, not kinetic performance, expression levels, confirmed functional capacity, or regulation. It should be interpreted as a KO annotation coverage indicator to be integrated with other annotation-level, toxicological, and network-level analyses in BioRemPP.
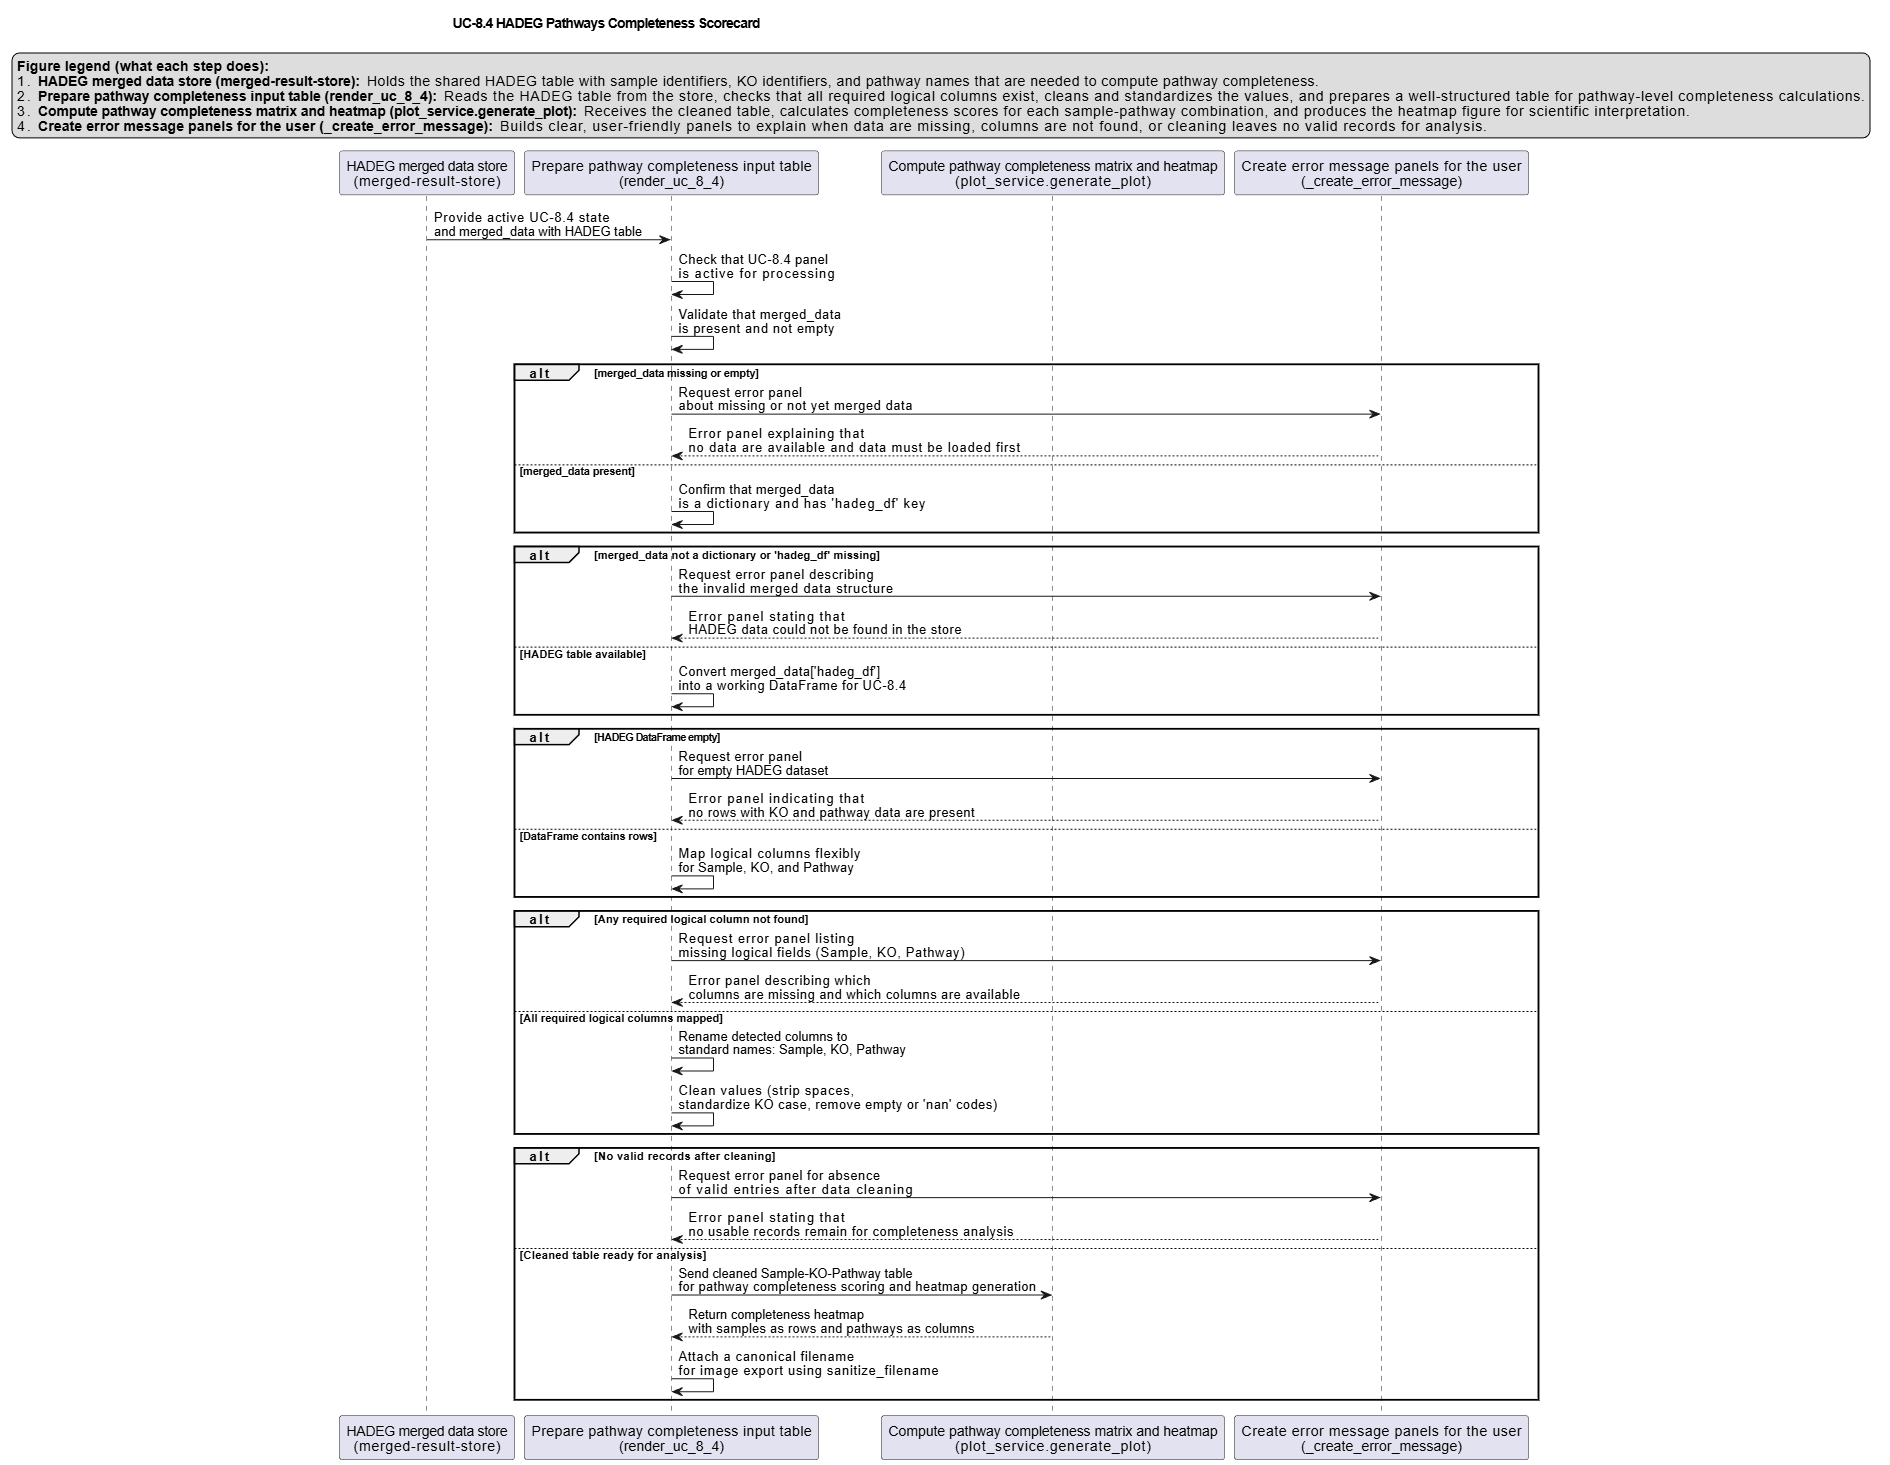
Activity diagram of the use case
Click on the image to enlarge and explore details.