UC-8.6 — Pathway-Centric Consortium Design by KO Coverage
Module: 8 – Assembly of Functional Consortia
Visualization type: Interactive UpSet plot (KO set intersections across samples for a selected pathway)
Primary inputs: HADEG_Results.xlsx or HADEG_Results.csv (sample–KO–pathway associations)
Primary outputs: Set- and intersection-level view of KO coverage across samples for one target pathway
Scientific Question and Rationale
Question: For a specific metabolic pathway, how are its annotated KO identifiers distributed across different samples, and what does their overlap reveal about annotation redundancy and complementarity?
The analysis focuses on a single target degradation pathway at a time and examines how its annotated KEGG Orthology (KO) identifiers are distributed across the available samples. By representing each sample as a set of pathway-specific KOs and analyzing the intersections of these sets via an UpSet plot, this visualization can provide a pathway-centric lens on:
- annotation redundancy (shared KOs),
- annotation complementarity (unique KOs contributed by different samples), and
- potential keystone samples that uniquely carry KOs absent from all other samples.
This may support annotation-guided, pathway-oriented hypothesis generation for candidate consortium assembly (experimental validation required to confirm functional capacity).
Data and Inputs
- Primary data source:
HADEG_Results.xlsx or HADEG_Results.csv(semicolon-delimited) - Key columns:
sample– identifier for each biological sampleko– KEGG Orthology (KO) identifier annotated for that sample-
compound_pathway– HADEG pathway label associated with the KO -
Set-based elements:
- Sets: Individual
samples (each represented by the KOs it contributes to the selected pathway). - Elements: Unique KOs required for that pathway within the dataset.
Analytical Workflow
- User Selection (Target Pathway)
The user selects a target metabolic pathway from an interactive dropdown menu. -
Internally, this corresponds to a specific
compound_pathwayvalue. -
Dynamic Filtering
The HADEG results tableHADEG_Results.xlsx or HADEG_Results.csvis filtered to retain only rows where: compound_pathwayequals the selected pathway, and- both
sampleandkoare valid and non-missing.
This subset represents all observed KO contributions to the chosen pathway across all samples.
- Set Construction (Sample-wise KO Repertoires)
The filtered data is grouped bysample. - For each
sample, a set of unique KOs (ko) associated with the selected pathway is constructed. -
Each set defines the pathway-specific KO annotation profile of that sample.
-
Intersection Calculation and UpSet Data Preparation
- All sample-specific KO sets are used to compute set sizes (per sample) and intersection sizes (KO counts shared by specific combinations of samples).
-
Intersections are ranked by cardinality (number of KOs in each intersection) to emphasize the most functionally relevant overlaps.
-
Rendering as UpSet Plot
The processed set and intersection statistics are rendered as an UpSet plot composed of: - a left bar chart (set sizes),
- a bottom intersection matrix (connected dots),
- and a top bar chart (intersection sizes).
How to Read the Plot
-
Dropdown Menu
Use the menu to select the Target Pathway (compound_pathway) to analyze.
The entire analysis (filtering, set construction, intersection computation, and plotting) is recomputed for the selected pathway. -
Set Size (Left Bar Chart)
- Each bar on the left represents one Sample.
- The height of the bar equals the number of unique KOs from that pathway present in that sample.
-
This provides a direct measure of how many pathway KOs each sample contributes individually.
-
Intersection Matrix (Bottom Panel)
- Each row corresponds to a sample.
- Each column corresponds to a specific intersection (combination of samples).
- Connected dots in a column indicate which samples participate in that particular intersection.
-
For example, a column with dots connected for Sample A and Sample B (and no others) represents KOs shared exclusively between A and B (for this pathway).
-
Intersection Size (Top Bar Chart)
- Each bar above the matrix represents the size of the intersection defined by the connected dots directly below.
- Bar height equals the number of KOs in that specific combination of samples.
- Taller bars correspond to large shared KO subsets, while shorter bars indicate smaller overlaps or unique contributions.
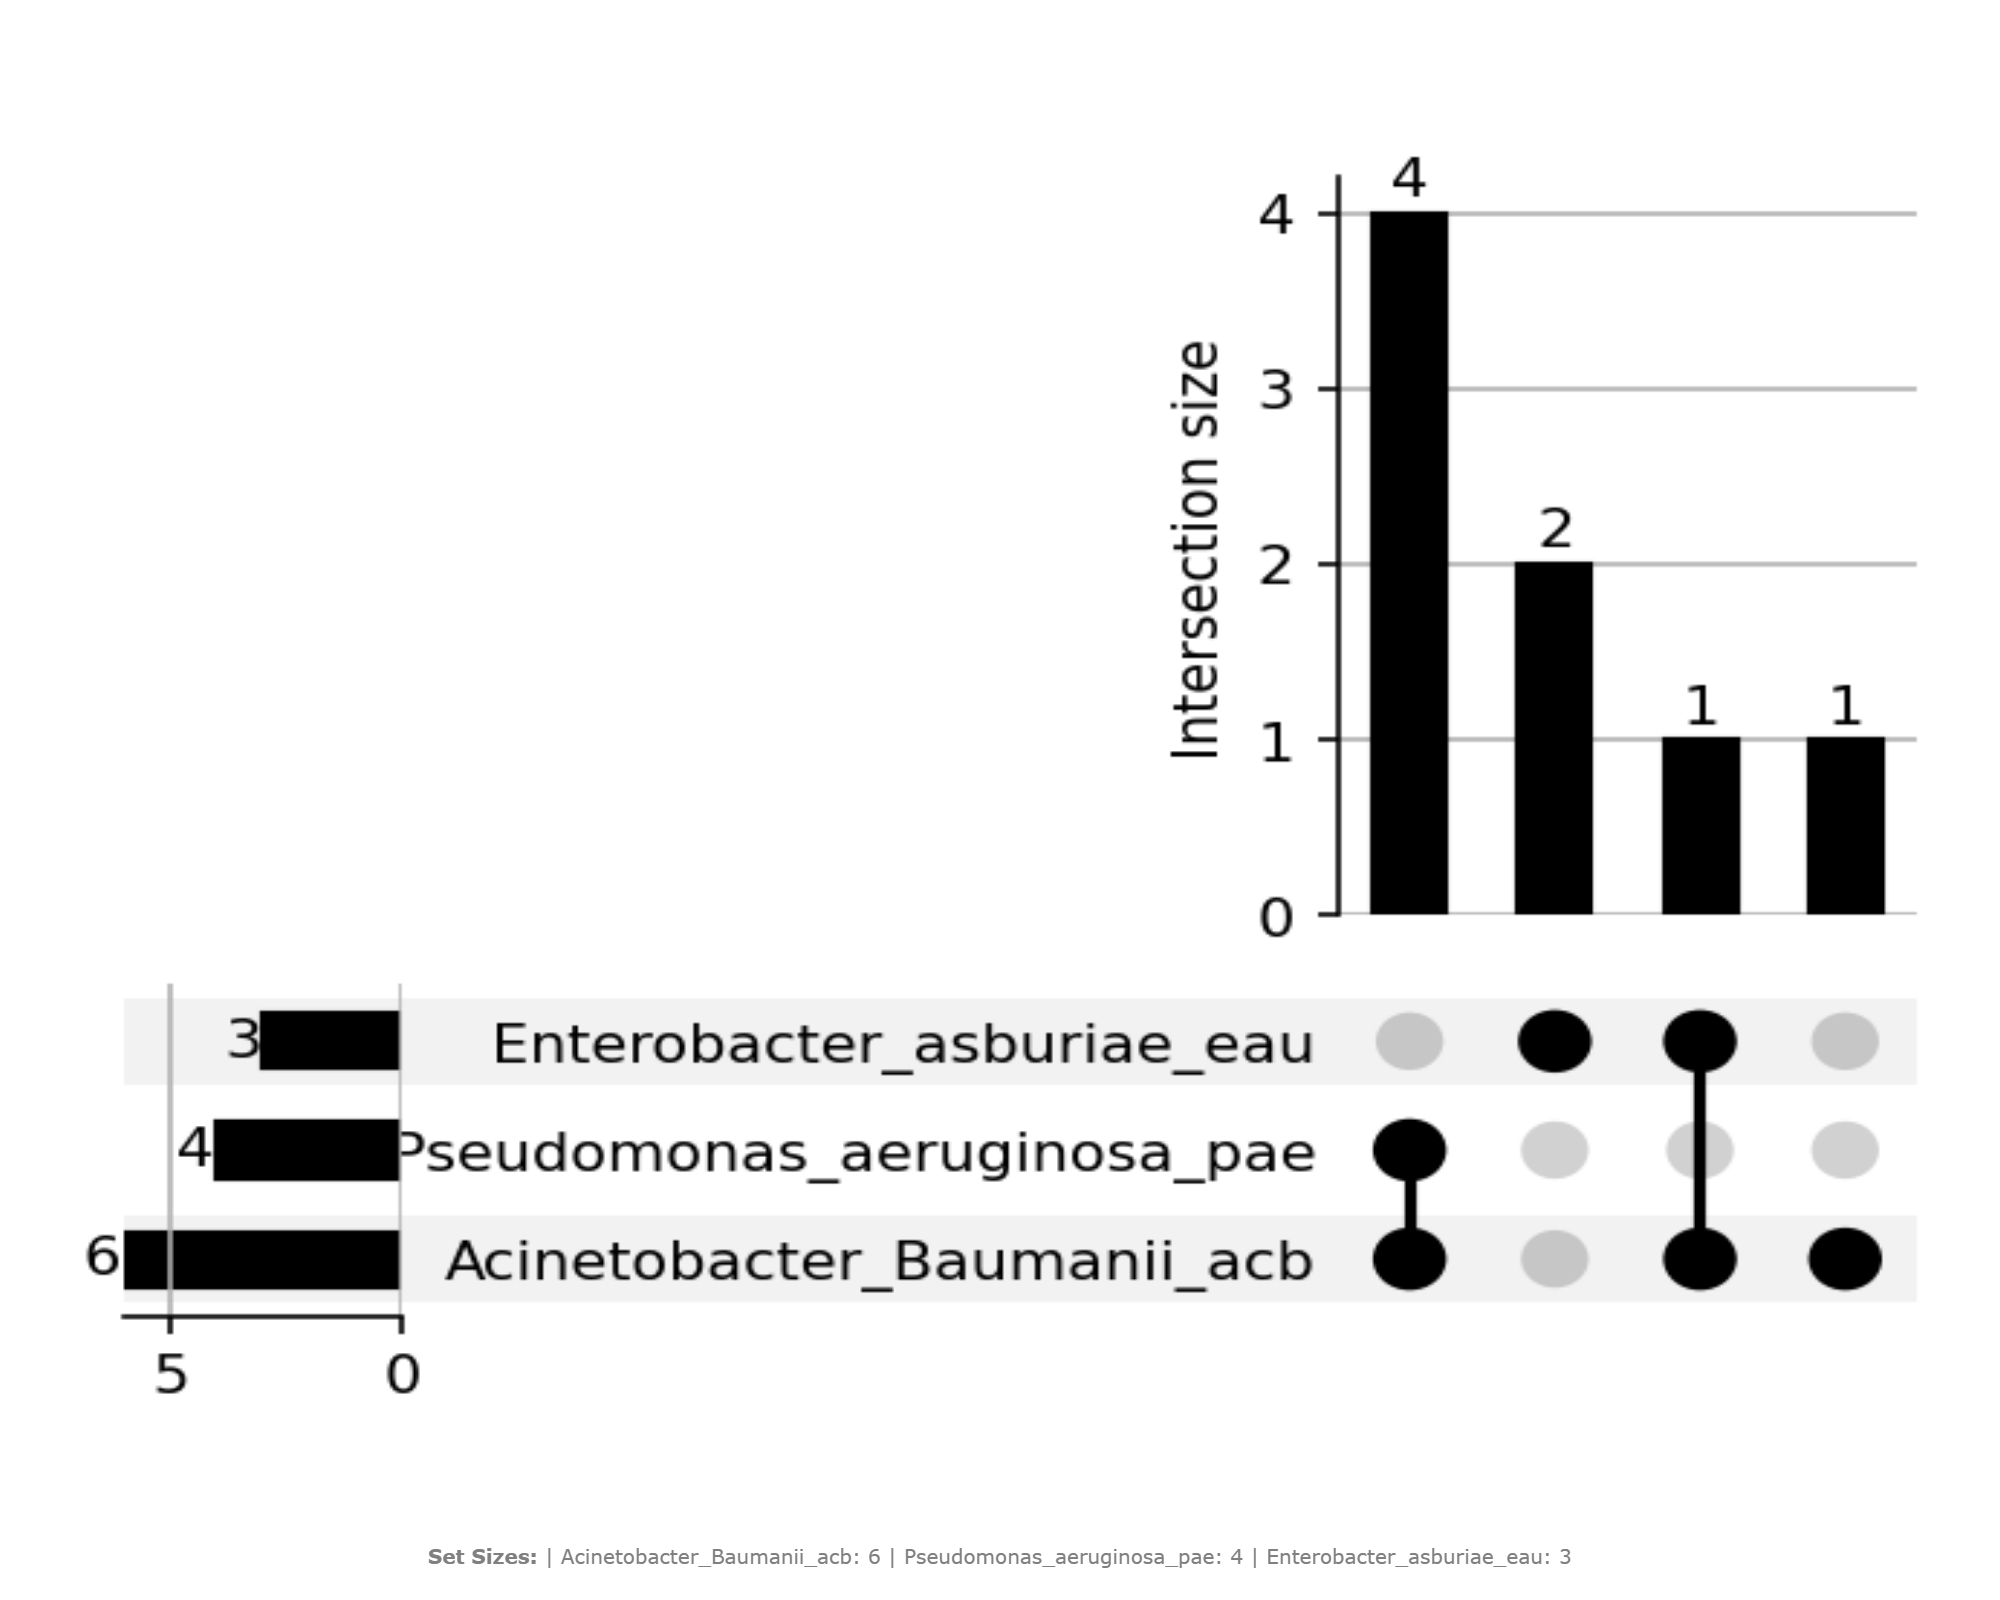
Representative Output
The image below illustrates a representative output generated by this use case using the example dataset.
Click on the image to enlarge and explore details.
Interpretation and Key Messages
- KO Annotation Redundancy
- Large bars over intersections involving multiple samples may indicate strong annotation redundancy: many samples share the same pathway KOs.
-
Redundant KOs at the annotation level may be a starting point for robustness hypotheses, though functional compensation requires experimental validation.
-
KO Annotation Complementarity
- Intersections with small but distinct KO sets, especially when combined across columns, may highlight complementary annotation contributions.
-
If the union of KOs across several intersections is required to cover the full pathway KO set in the dataset, the pathway has distributed annotation coverage across multiple samples; candidate consortia may be worth exploring.
-
Annotation-unique Samples
- Bars above a single, unconnected dot (i.e., KOs present only in one sample) may indicate unique KO annotations contributed by that sample.
-
A sample that uniquely carries KOs relevant to pathway completeness at the annotation level could be considered an annotation-level keystone candidate for that pathway (experimental validation required).
-
Annotation-guided Consortium Hypothesis
- The UpSet plot may help identify minimal candidate consortia at the annotation level:
- prioritize samples that jointly cover the largest number of unique pathway KOs,
- minimize annotation redundancy when desired (for parsimony), or preserve it as a proxy for potential robustness.
- Users can conceptually apply set cover reasoning: choose the smallest set of samples whose KO union approximates or achieves full pathway KO coverage in the dataset.
Reproducibility and Assumptions
- Input Format
The analysis requires a semicolon-delimited HADEG results table containing at least: sample,ko,-
compound_pathway(pathway identifier to be used in the dropdown selection). -
Set Definition
- Each sample's set consists of unique KOs for the selected pathway only.
-
Multiple occurrences of the same
(sample, ko, compound_pathway)entry in the raw data do not affect set size (duplicates are removed). -
Pathway KO Universe
- The total KO universe for a pathway is defined by all unique KOs observed for that
compound_pathwayinHADEG_Results.xlsx or HADEG_Results.csv. -
No external canonical KO list is enforced.
-
Interpretation Scope
- The UpSet plot encodes KO annotation presence/absence relationships, not kinetic rates, expression levels, confirmed functional capacity, or regulatory control.
- It should be interpreted as a structural map of KO annotation distribution across samples, to be integrated with completeness scores (UC-8.4 / UC-8.5) and other BioRemPP analyses during annotation-guided hypothesis generation.
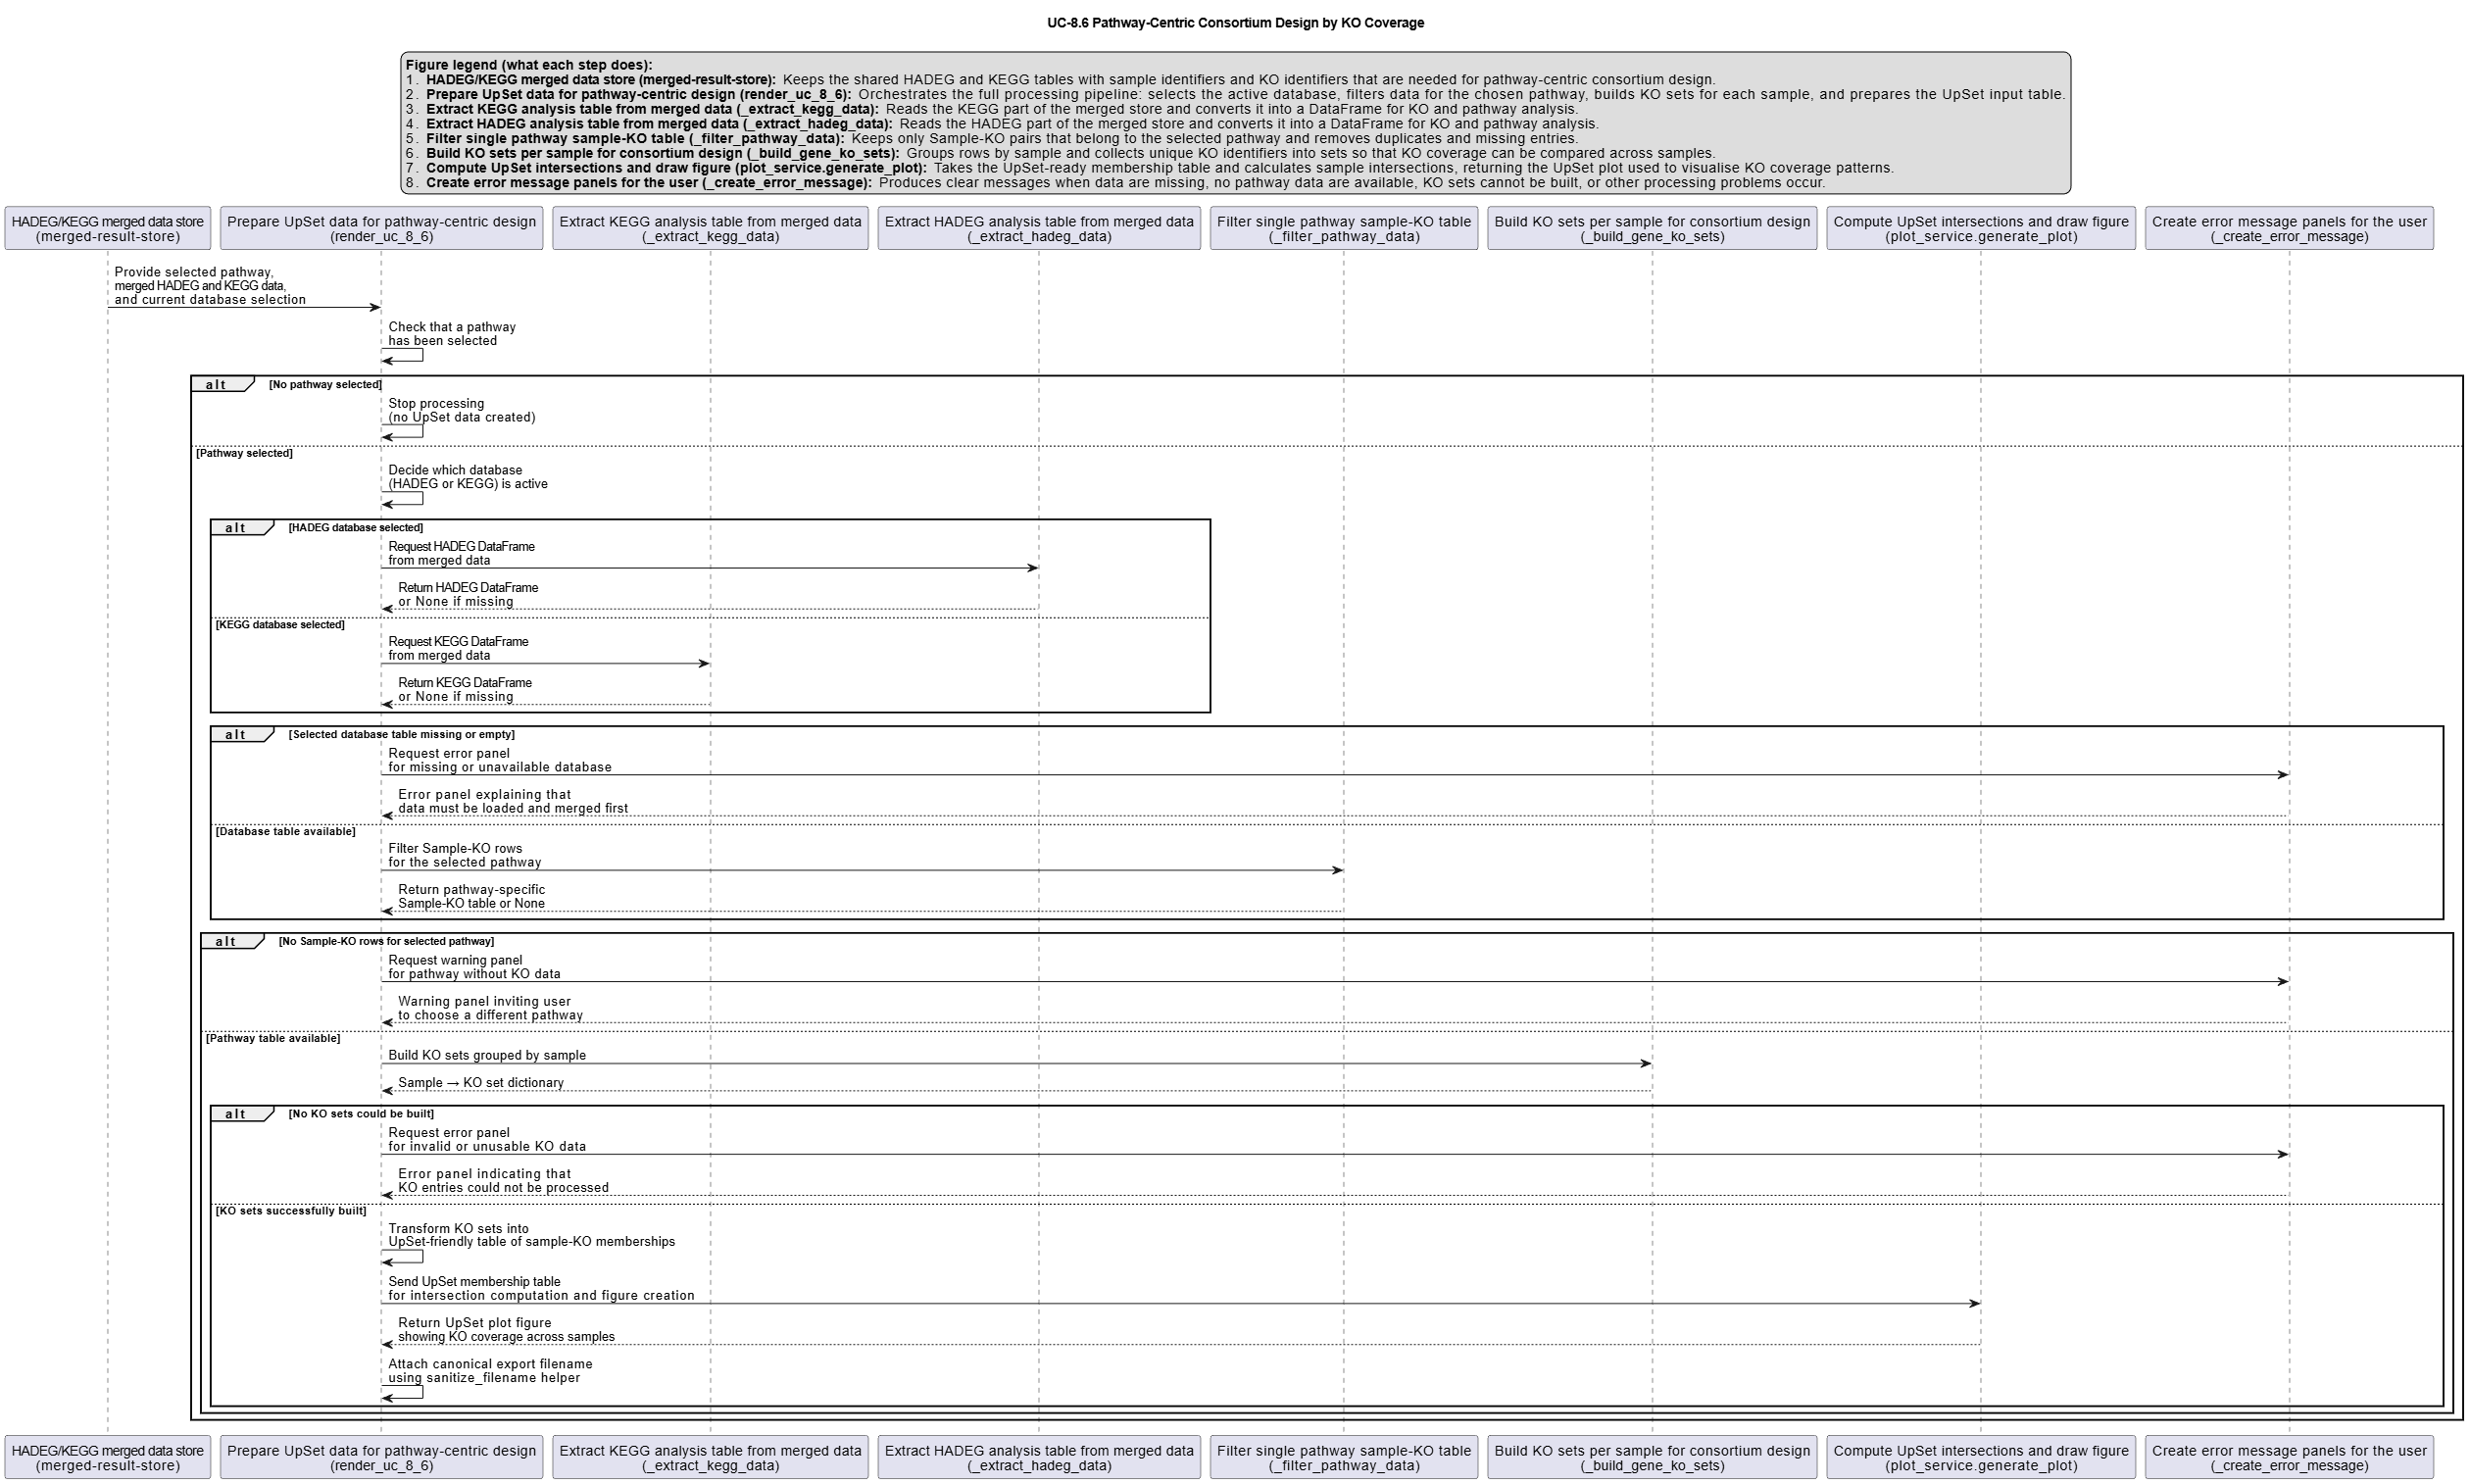
Activity diagram of the use case
Click on the image to enlarge and explore details.