UC-8.7 — Sample-Sample KO Intersection Profile
Module: 8 – Assembly of Functional Consortia
Visualization type: Interactive UpSet plot (KO set intersections across user-selected samples)
Primary inputs: BioRemPP_Results.xlsx or BioRemPP_Results.csv (sample–KO associations)
Primary outputs: Intersection statistics for KEGG Orthology (KO) sets across selected samples
Scientific Question and Rationale
Question: How many KO identifiers are shared across the selected samples, and which samples carry unique or rare KO annotations?
The goal is to quantify and visualize how KEGG Orthology (KO) identifiers are distributed across samples, potentially identifying:
- a core KO set shared by many or all samples, and
- unique or rare KOs that are found only in specific samples.
Instead of relying on Venn diagrams—which become unreadable as the number of sets increases—the analysis employs an UpSet plot, a scalable approach that enumerates and ranks all relevant set intersections. This can provide a rigorous foundation for reasoning about annotation redundancy, annotation complementarity, and potential annotation-based sample groups within the collection of samples.
Data and Inputs
- Primary data source:
BioRemPP_Results.xlsx or BioRemPP_Results.csv(semicolon-delimited) - Key columns:
sample– identifier for each biological sample-
ko– KEGG Orthology (KO) identifier associated with that sample -
Set definition:
- Sets: Individual
samples (each represented by its KO repertoire) -
Elements: Unique KO identifiers (
ko) observed in the selected subset of samples -
User control:
- A multi-select dropdown allowing selection of two or more samples to include in the intersection analysis.
Analytical Workflow
- Sample Selection (User Input)
The user selects two or more samples from a multi-select dropdown control. - A minimum of two samples is required to generate meaningful intersections.
-
The downstream analysis is dynamically restricted to this subset.
-
Data Loading and Filtering
- The results table
BioRemPP_Results.xlsx or BioRemPP_Results.csvis loaded. -
The dataset is filtered to retain only rows whose
sampleappears in the user's selection and for which bothsampleandkoare valid and non-missing. -
Set Construction (Per-Sample KO Repertoires)
- The filtered data is grouped by
sample. - For each
sample, a set of unique KOs is constructed. -
These sets encode the KO annotation profiles of the selected samples.
-
Intersection Computation and Ranking
- From the per-sample KO sets, all relevant set intersections are computed.
- For each intersection (i.e., a specific combination of samples), the intersection size (number of shared KOs) is calculated.
-
Intersections are ranked by cardinality, so the most informative overlaps appear prominently in the UpSet plot.
-
Rendering as UpSet Plot
The processed set and intersection statistics are rendered as an UpSet plot, comprising: - a set size bar chart (left),
- an intersection matrix (bottom), and
- an intersection size bar chart (top).
How to Read the Plot
- Sample Multi-Select Dropdown
- Use the dropdown to choose two or more samples for analysis.
-
The UpSet plot recomputes and updates automatically whenever the selection changes.
-
Set Size (Left Bar Chart)
- Each horizontal bar corresponds to a single sample.
- Bar length indicates the total number of unique KOs present in that sample.
-
Taller bars represent samples with higher KO annotation richness.
-
Intersection Matrix (Bottom Panel)
- Each row corresponds to one of the selected samples.
- Each column corresponds to one intersection pattern (a particular combination of samples).
- Dots indicate membership: a dot in a row means that sample is part of that intersection.
- A vertical line connecting dots in multiple rows indicates that the bar above represents KOs shared only by those specific samples.
-
A column with a single dot and no connections represents KOs unique to that sample.
-
Intersection Size (Top Bar Chart)
- Each vertical bar directly above a column in the matrix represents the number of KOs in that specific intersection.
- Taller bars correspond to larger shared KO sets, highlighting prominent patterns of gene sharing or uniqueness.
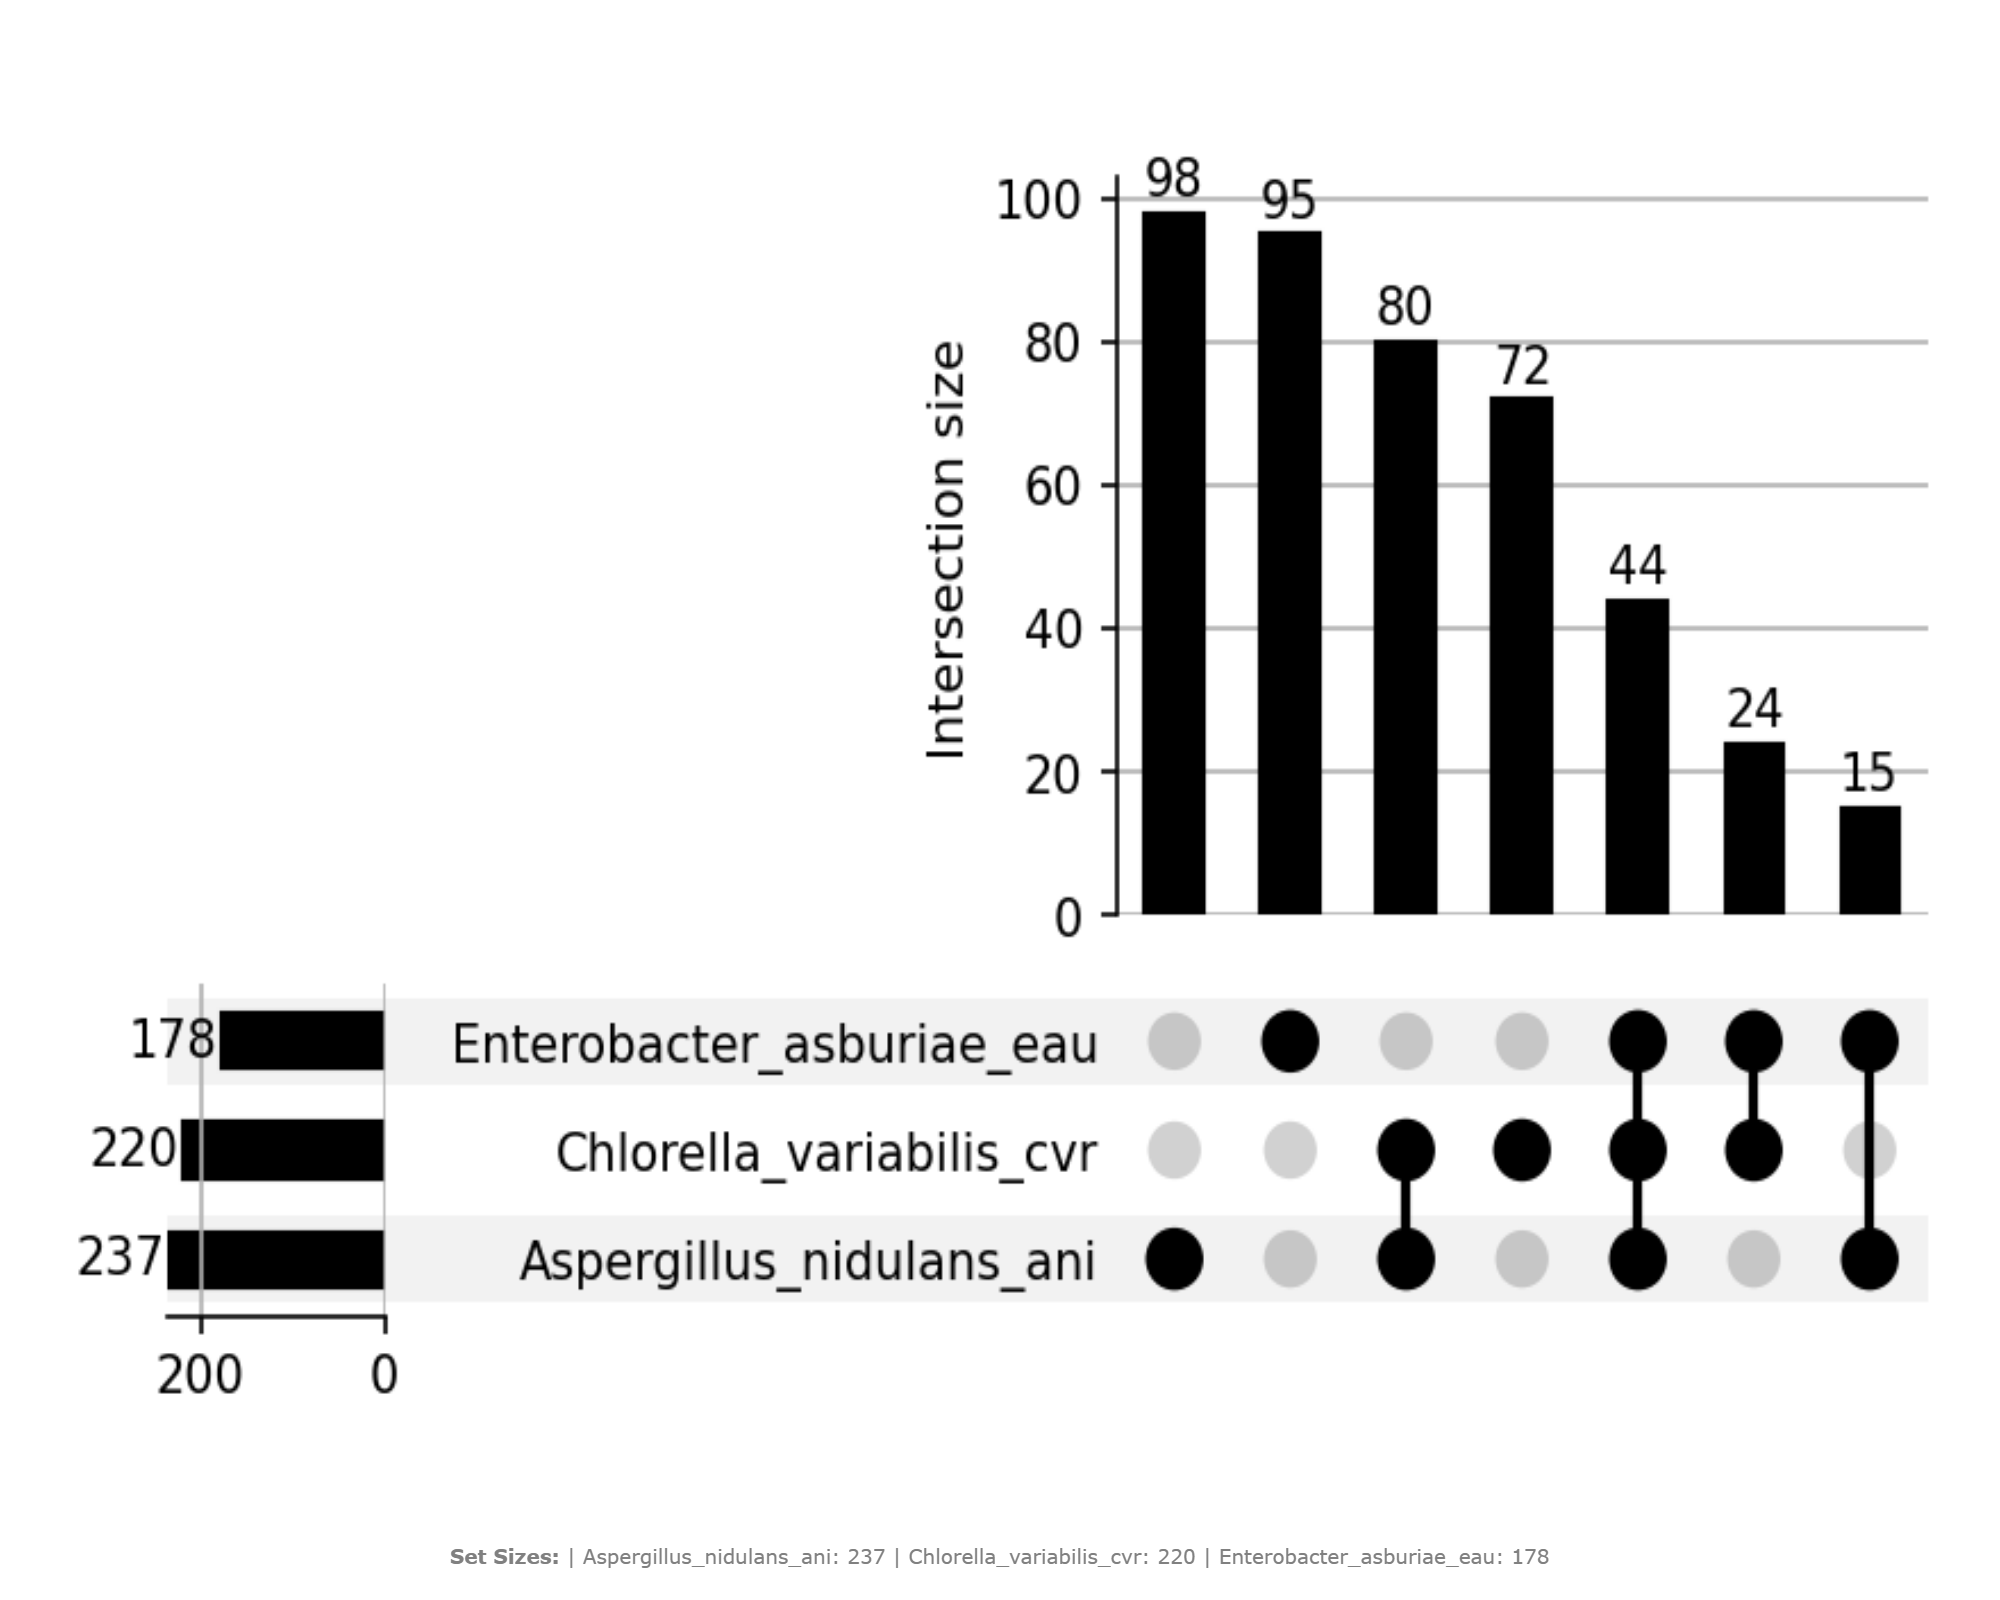
Representative Output
The image below illustrates a representative output generated by this use case using the example dataset.
Click on the image to enlarge and explore details.
Interpretation and Key Messages
- Core KO Annotation Set
- A large bar associated with the intersection involving all selected samples may reflect the core KO set shared across the group.
-
These KOs are widely co-annotated across samples and could represent broadly distributed annotation patterns in the database.
-
Sample-Specific KO Annotations
- Bars above columns with a single dot (no connections) may reveal sample-specific KO annotations.
-
These unique KO identifiers could be starting points for investigating annotation patterns that may underlie specialized or niche characteristics (experimental validation required to confirm functional roles).
-
KO Annotation Redundancy and Overlap
- Intersections with large bars spanning multiple connected dots may reveal annotation redundancy: several samples carry the same KO subset.
-
High annotation redundancy may suggest potential annotation overlap, which could be explored as a hypothesis for functional backup capacity (experimental validation required).
-
Pairwise KO Annotation Similarity
- Bars over columns with exactly two connected dots quantify KOs shared exclusively by those two samples.
-
These patterns may indicate:
- high KO annotation similarity between specific sample pairs,
- possible annotation-level complementarity or overlap, or
- starting points for investigating evolutionary or ecological relationships.
-
Multi-Sample Intersections and Annotation-based Groups
- More complex intersection patterns (multiple connected dots involving subsets of samples) may correspond to annotation-based sample groups:
- groups of samples that share specific KO subsets,
- potentially indicating shared annotation contexts in the database.
These annotation groups can guide the generation of hypotheses for candidate consortia that combine complementary KO annotation profiles (experimental validation required to confirm functional cooperation).
Reproducibility and Assumptions
- Input Format
The analysis requires a semicolon-delimited BioRemPP results table containing at least: sample(sample identifier),-
ko(KO identifier). -
Set Definition and De-duplication
- Each sample's KO repertoire is treated as a set of unique KOs.
-
Multiple occurrences of the same
(sample, ko)pair in the raw data do not increase set size. -
Selection Constraints
- At least two samples must be selected to compute informative intersections.
-
Interpretation should consider that different sample subsets will yield different core and unique KO patterns.
-
Scope of Inference
- The UpSet plot encodes KO annotation presence/absence only; it does not account for KO copy number, expression levels, confirmed functional capacity, or regulation.
- Results should be interpreted as a structural map of KO annotation distribution, to be integrated with other BioRemPP modules (e.g., pathway completeness, toxicological profiling, regulatory relevance) for annotation-guided hypothesis generation.
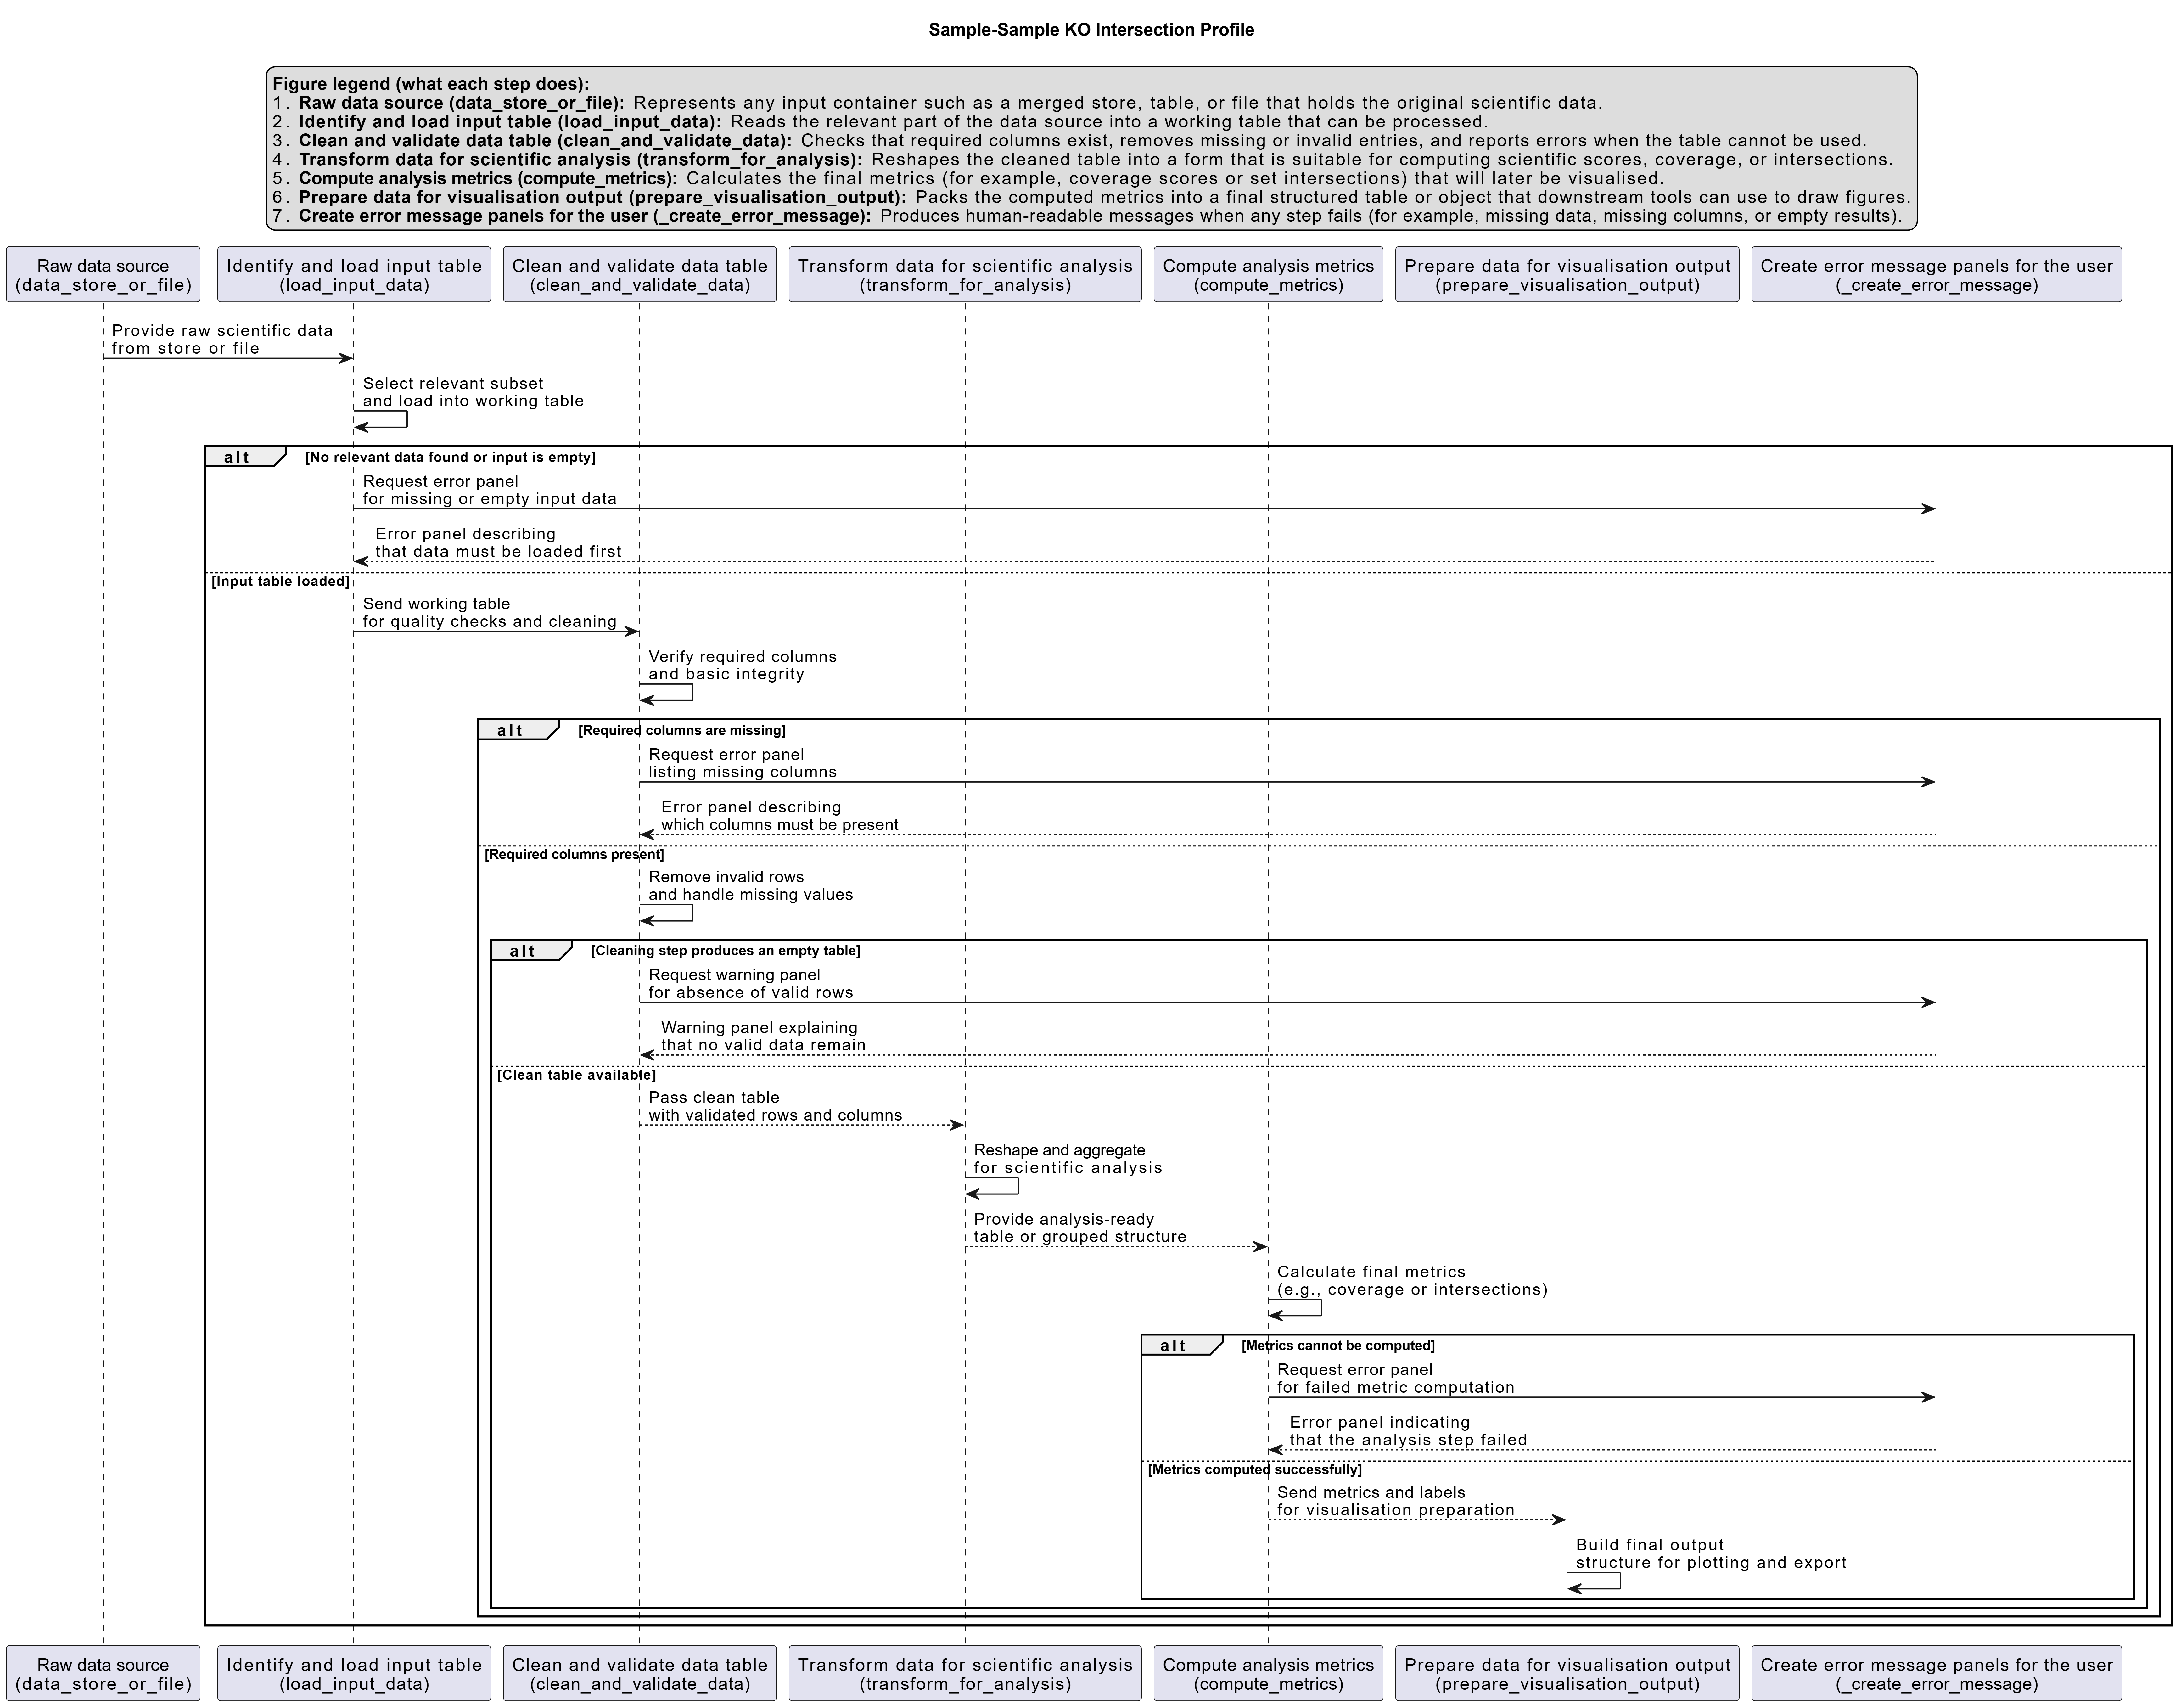
Activity diagram of the use case
Click on the image to enlarge and explore details.